Why We Chose Netdata
When I joined this project, I was assigned to handle infrastructure settings.
Since our budget was limited, we had to minimize memory and CPU usage.
We decided that if memory or CPU usage stays above 70% consistently, we will increase the resources.
Given the situation, we needed to monitor memory and CPU usage continuously, so we decided to use Netdata on our Ubuntu based system.
Netdata
Netdata is a lightweight, open-source monitoring tool that provides real-time system and application performance metrics, along with alerting.
If it had been heavy, I would have chosen a different open-source solution.
Install
While there are multiple ways to install Netdata, I decided to install it directly on Ubuntu.
curl https://get.netdata.cloud/kickstart.sh > /tmp/netdata-kickstart.sh && sh /tmp/netdata-kickstart.sh --no-updates --stable-channel --disable-telemetryhttps://learn.netdata.cloud/docs/netdata-agent/installation/linux/
You can refer to the documentation above.
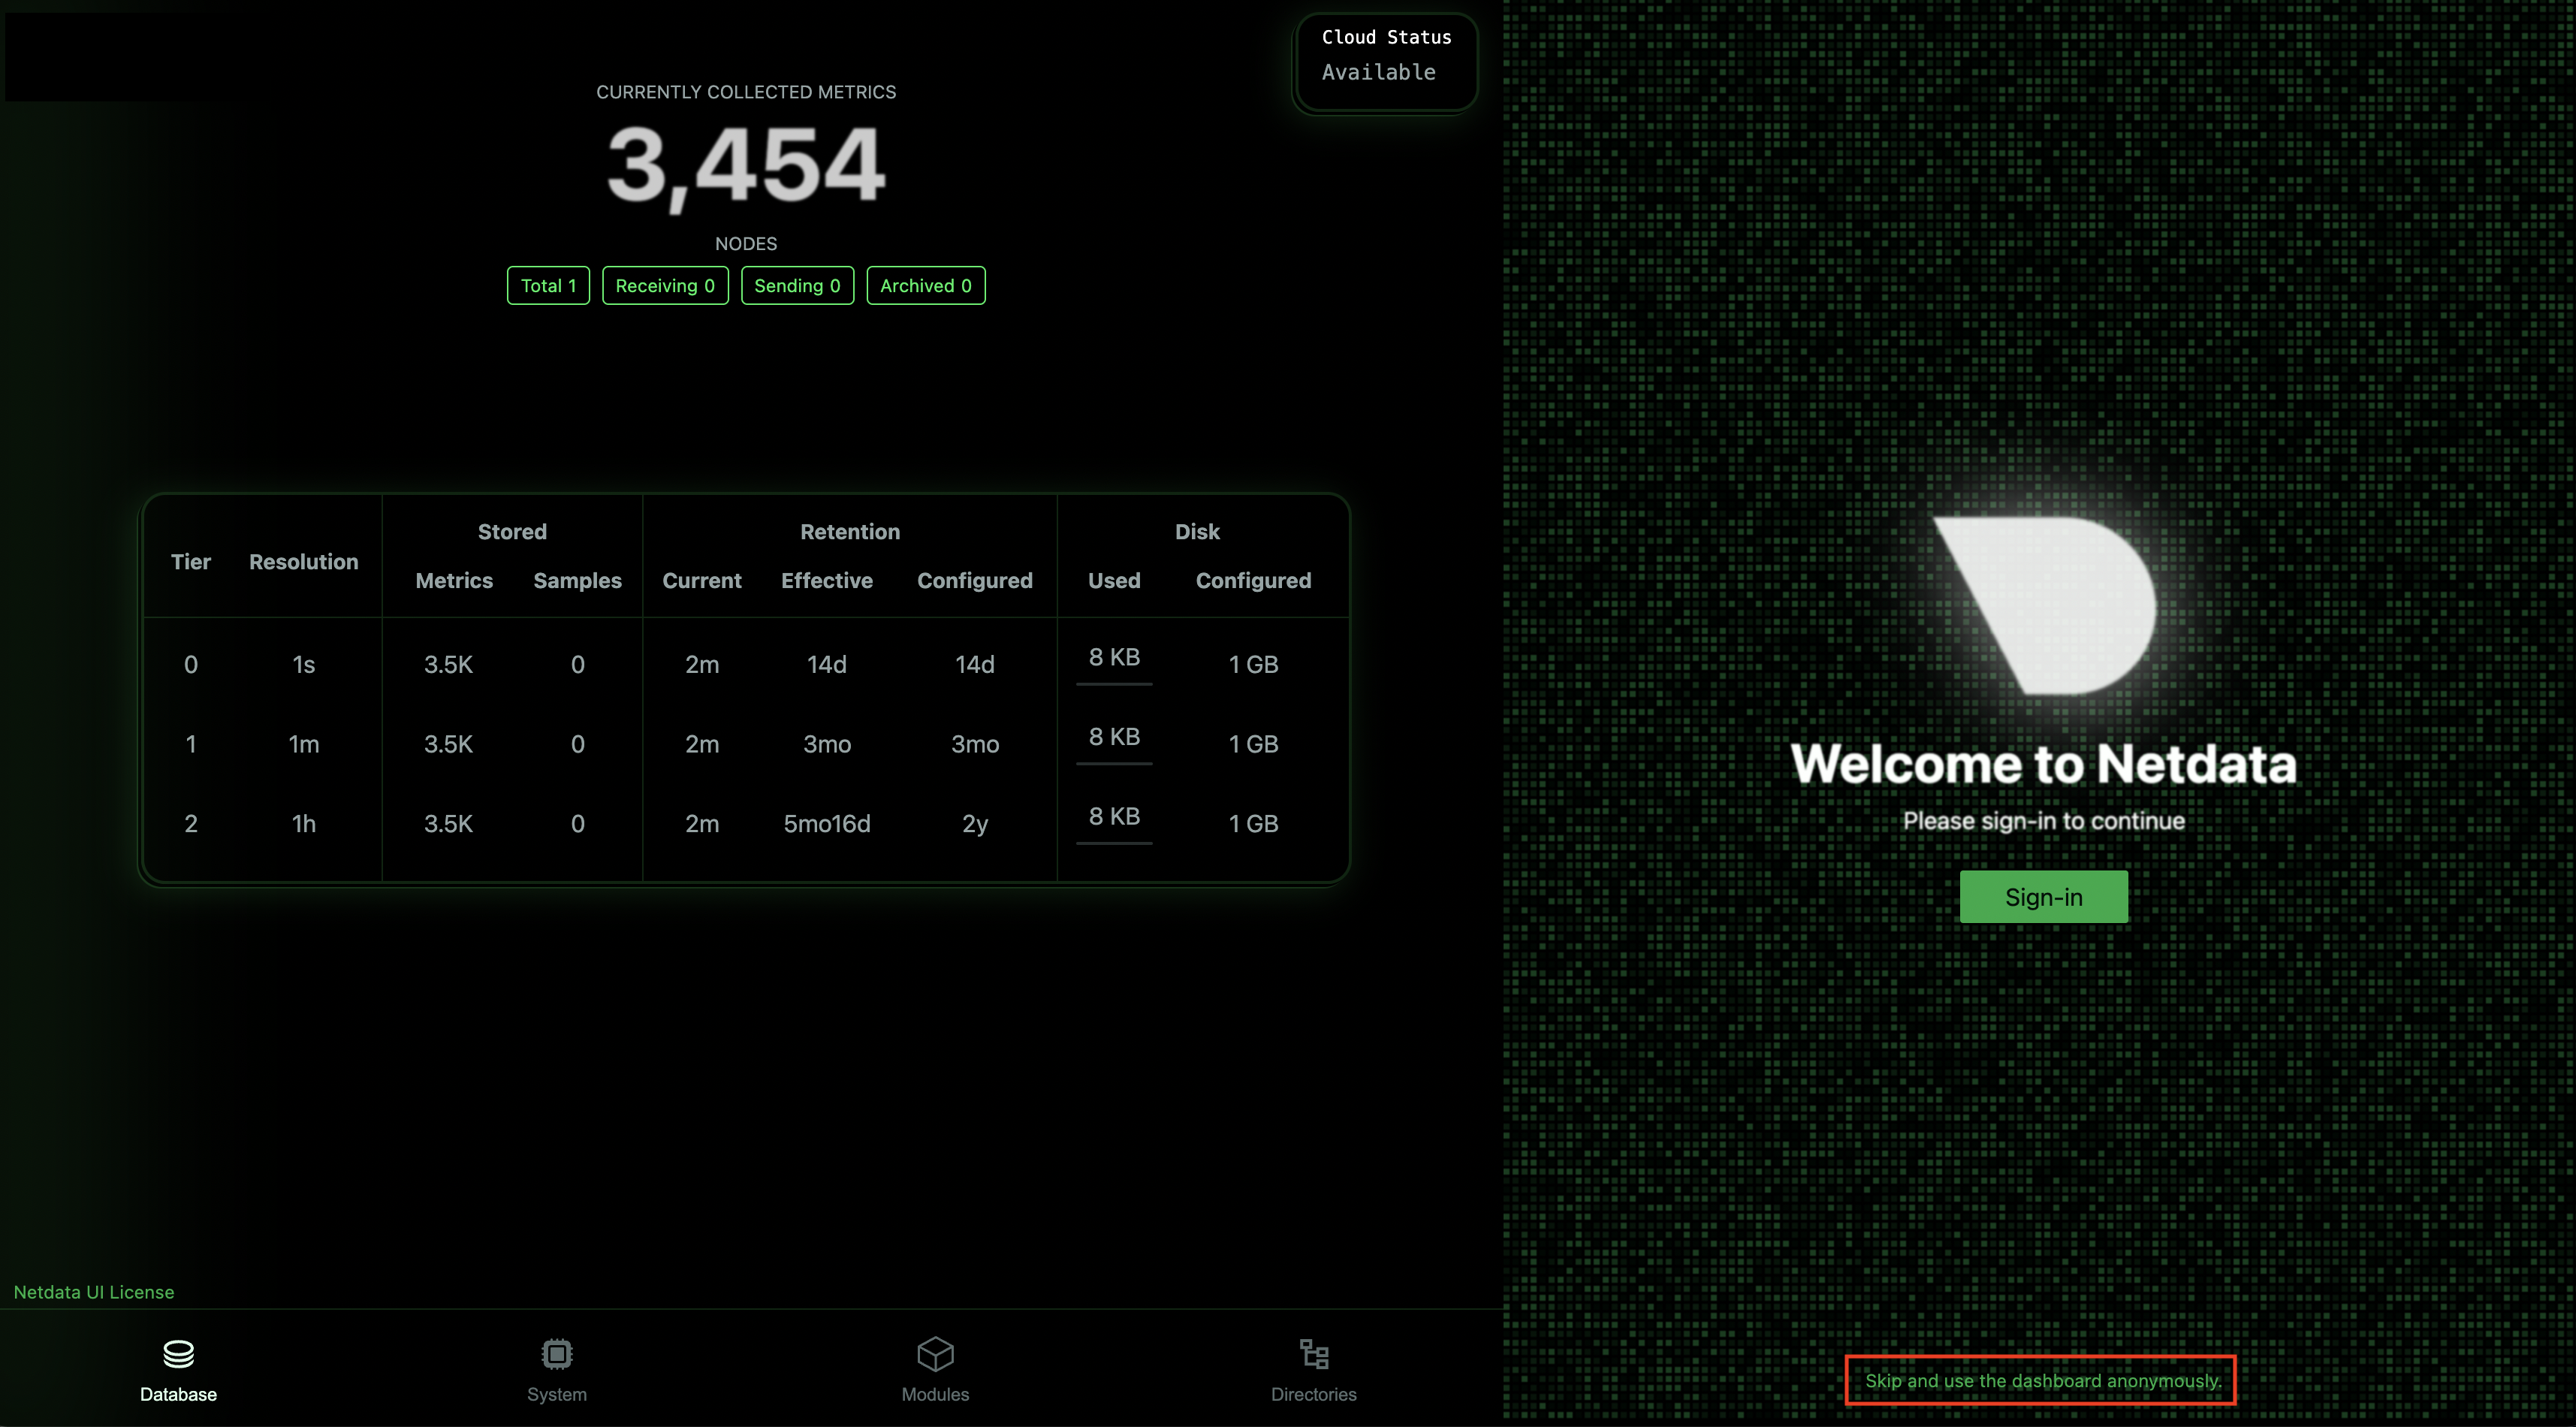
After installing Netdata, you can access it by navigating to port 19999. You’ll see a dashboard such as the one above.
To view detailed graphs, click the button at the bottom right.
Setting Up ID and Password (Optional)
I configured Nginx to route requests to Netdata through a specific URL.
Because of this, anyone could access the Netdata dashboard without authentication,
so I needed to secure it with a username and password.
First, run the following command:
sudo apt install apache2-utilsThen You got htpasswd.
Next, use the following command to create a username and password.
sudo htpasswd -c /etc/nginx/.htpasswd usernameAfter entering the password and pressing enter, it will be created.
The -c option is for creating a new file. When adding additional users, remove this option.
If you're using Nginx, add the following configuration.
location /netdata/ {
  ...other settings

  auth_basic "Restricted Access";
  auth_basic_user_file /etc/nginx/.htpasswd;
}
Add the above configuration to nginx.conf (default.conf) File.
# 설정 오류 체크
sudo nginx -t

# reload 서버
sudo systemctl reload nginx
After that, you can check for errors using the command. If everything looks fine, restart the service using the appropriate command.
Now, when you access Netdata, you’ll see that the ID and password authentication is enabled.
Setting Up Slack Integration
First, you need to create a channel in Slack where you want to receive alerts.
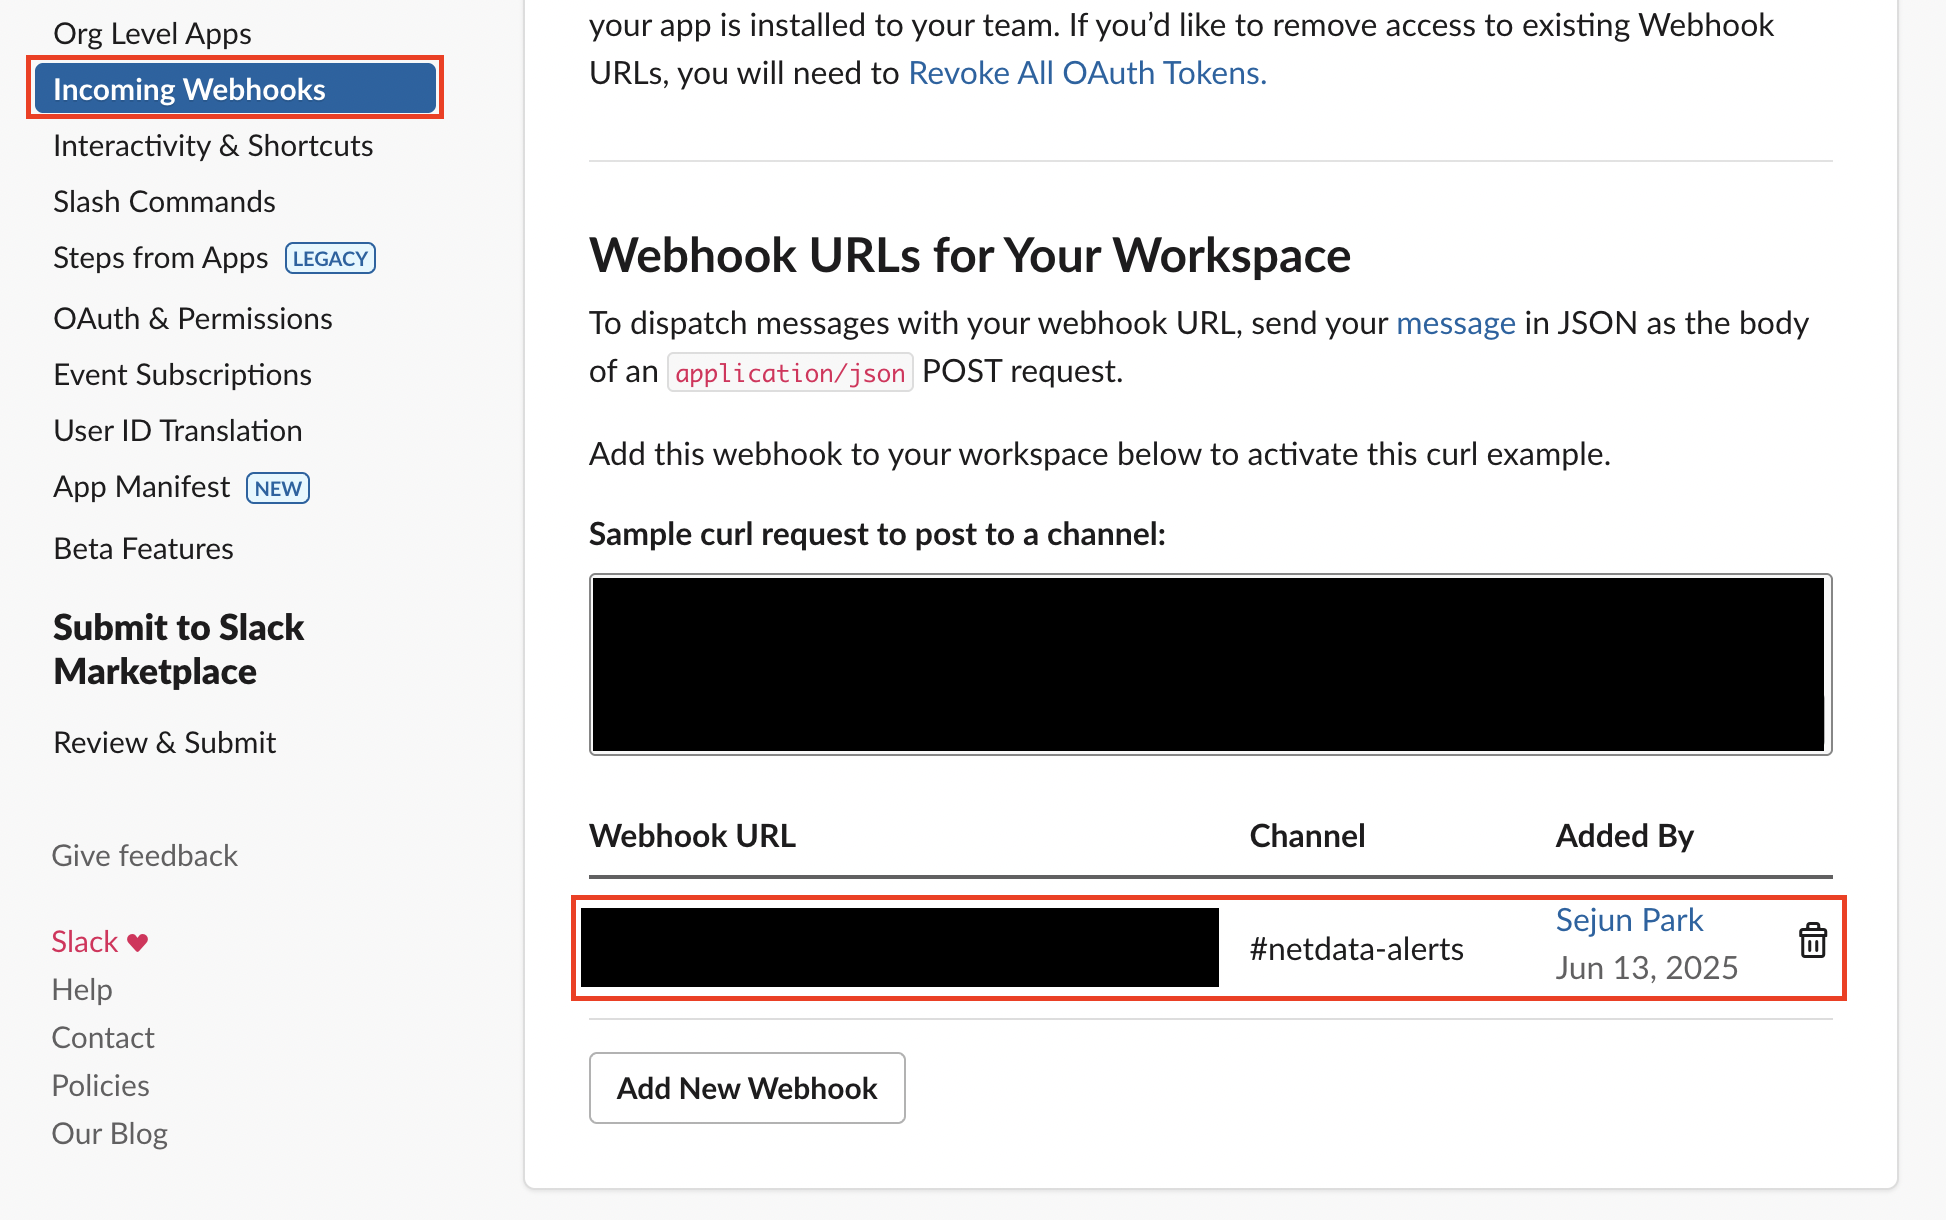
After creating the channel, visit https://api.slack.com/messaging/webhooks and follow the instructions to create a WebHook.
Following these steps will give you a Webhook URL as shown in the image below.
Now we need to modify the health_alarm_notify.conf file. I'll be using a copy of the original file.
I accessed the console directly via SSL.
Here's why I'm using a copy instead of modifying the original file:
- Custom settings: /etc/netdata/
- Kickstart installation: /opt/netdata/etc/netdata/
- Default: /usr/lib/netdata/conf.d/
Netdata searches for configuration files in this order. If it finds the file in /etc/netdata, it will use that file and stop searching.
If we use health_alarm_notify.conf from /usr/lib/netdata/conf.d/, our settings would be overwritten during updates, requiring us to reconfigure everything.
Therefore, we'll use the custom settings approach (option 1) by copying the file to our preferred location.
sudo cp /usr/lib/netdata/conf.d/health_alarm_notify.conf /etc/netdata/
sudo nano /etc/netdata/health_alarm_notify.conf
This will create a new file that you can modify using the nano command.
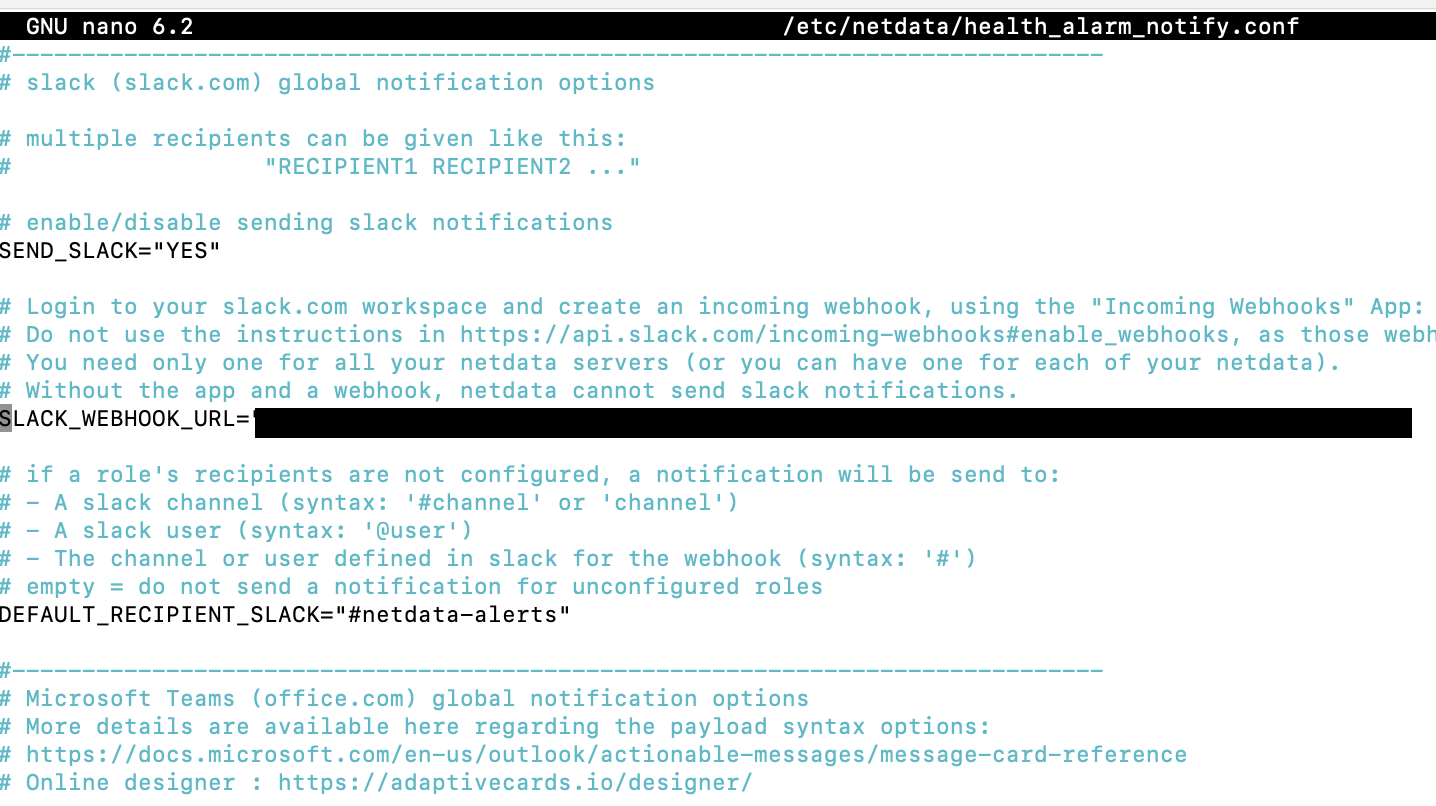
Search for SLACK_WEBHOOK_URL using Ctrl + W.
Add the Webhook URL you received from Slack to the SLACK_WEBHOOK_URL field.
Set DEFAULT_RECIPIENT_SLACK to the channel name you configured with the webhook.
It should look like this:
After making these changes, save with Ctrl + O and exit with Ctrl + X.
Then restart the Netdata server using sudo systemctl restart netdata.
Once you run the following command, a test message will be sent to your Slack channel.
sudo /usr/libexec/netdata/plugins.d/alarm-notify.sh test slack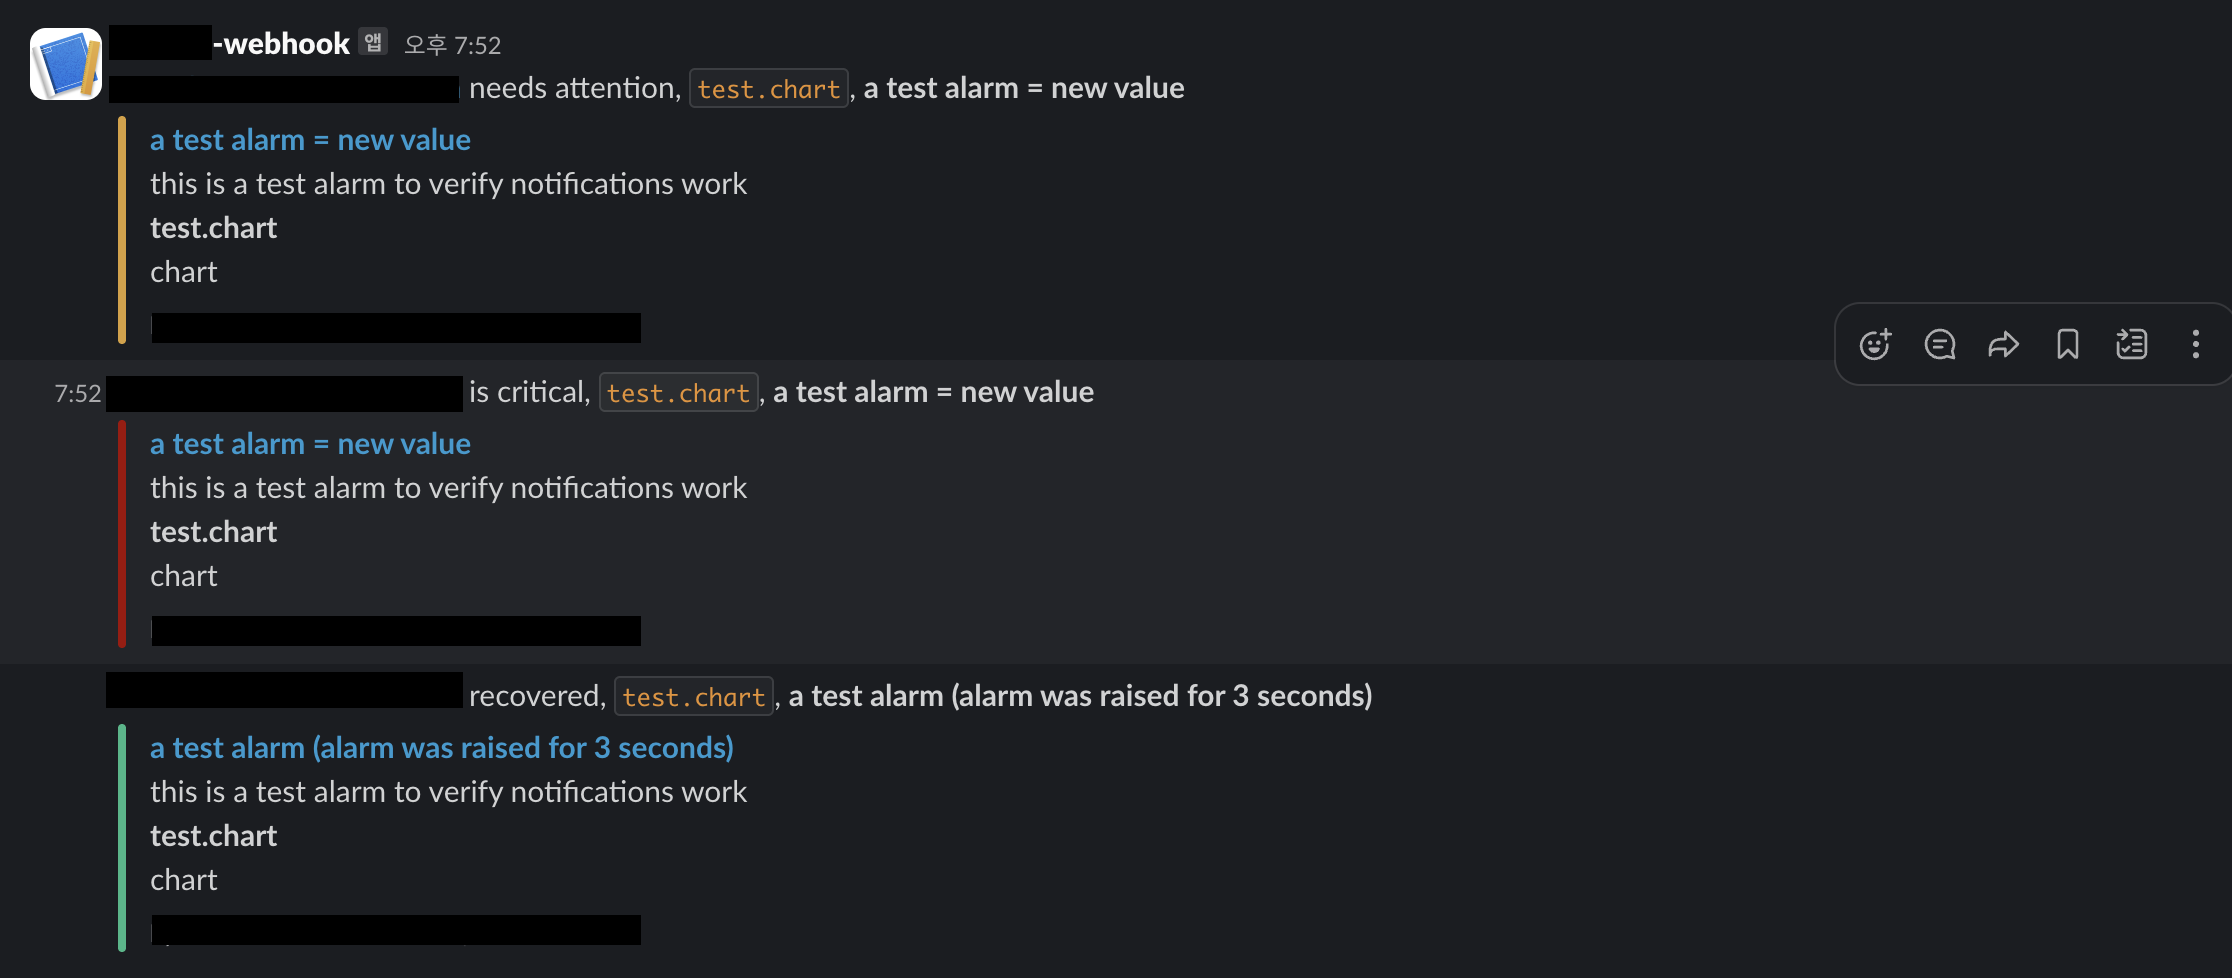
Setting Memory Thresholds
The main goal of all these configurations was to receive Slack alerts when resource usage exceeds certain thresholds.
https://learn.netdata.cloud/docs/alerts-&-notifications/alert-configuration-reference
I followed all commands from the official documentation and verified that they work correctly.
According to the documentation, we need to create a health.d/ram-usage.conf file.
In my case, I created the file at /etc/netdata/health.d/ram-usage.conf using the following commands:
sudo nano /etc/netdata/health.d/ram-usage.conf
### Please, enter the following settings.
alarm: ram_usage
on: system.ram
lookup: average -1m percentage of used
units: %
every: 1m
warn: $this > 60
crit: $this > 90
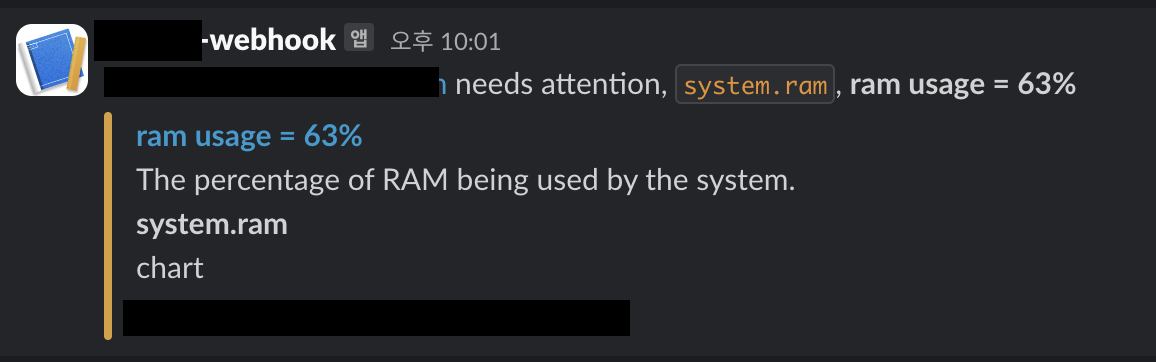
info: The percentage of RAM being used by the system.
###After saving the configuration, reload the health settings using the following command:
sudo netdatacli reload-healthAfter that, you’ll see a message appear in Slack, as shown below.
This completes all the necessary configurations.
With these settings in place, we can now monitor and utilize our server resources more efficiently.
Share this post
Comments (0)
No comments yet. Be the first to comment!