Setting Up Log Server using Docker on Ubuntu
June 17, 2025
Why You Need a Log Server
Before setting up a log server, I want to explain why we need one. One of the most important things I've learned in my career is how critical logging is.
When writing code, we perform many tasks to prevent errors, such as writing test code and end-to-end tests.
However, unexpected errors can still occur despite these precautions. What's important in these situations is quick error detection and hotfixes.
This is where logs become crucial.
In production servers, we can't easily check errors like we can in a console, so we need to handle logging thoroughly and be able to check these logs easily.
At my previous company, we used either Logstash + Kafka + Elasticsearch or Clickhouse + Grafana combinations.
The tech stack I'll be using is the Vector + Clickhouse + Grafana combination. And to make this combination easy to use, I'll be using Docker.
Setting Up
We'll proceed with the setup in this order: Docker install -> Docker compose -> other config files -> Clickhouse -> Grafana.
Docker Install
Ubuntu doesn't come with Docker preinstalled, so we need to install it first.
https://docs.docker.com/engine/install/ubuntu/
I followed the official documentation for the setup.
# Command
docker compose version
# Result
Docker Compose version v2.36.2
You can see that it works correctly through the above command.
Working with Docker Compose
I used Git Repository functionality to move this work from local to VPS server.
Reference: https://github.com/pkt369/log-server
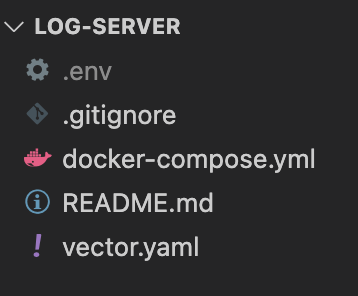
The structure is as shown above.
docker-compose.yml
services:
  clickhouse:
    image: clickhouse/clickhouse-server:latest
    container_name: clickhouse
    ports:
      - "8123:8123"     # HTTP interface
      - "9000:9000"     # Native TCP interface
    volumes:
      - clickhouse-data:/var/lib/clickhouse
    ulimits:
      nofile:
        soft: 262144
        hard: 262144
    environment:
      - CLICKHOUSE_USER=default
      - CLICKHOUSE_PASSWORD=${CLICKHOUSE_PASSWORD}
    healthcheck:
      test: ["CMD-SHELL", "wget --spider -q http://localhost:8123 || exit 1"]
      interval: 5s
      timeout: 3s
      retries: 5
      start_period: 3s

  vector:
    image: timberio/vector:latest-debian
    container_name: vector
    volumes:
      - ./vector.yaml:/etc/vector/vector.yaml:ro
      - /var/log/server:/var/log/server:ro
    environment:
      - CLICKHOUSE_USER=default
      - CLICKHOUSE_PASSWORD=${CLICKHOUSE_PASSWORD}
    depends_on:
      clickhouse:
        condition: service_healthy

  grafana:
    image: grafana/grafana:latest
    container_name: grafana
    ports:
      - "3030:3000"
    environment:
      - GF_SECURITY_ADMIN_PASSWORD=admin
    volumes:
      - grafana-data:/var/lib/grafana
    depends_on:
      - clickhouse

volumes:
  clickhouse-data:
  grafana-data:
First, I set up logging to /var/log/*.log and use ${CLICKHOUSE_PASSWORD} which is loaded from the env file.
Also, there was an issue where Vector would perform a healthcheck before Clickhouse finished setting up.
To solve this problem, I added a healthcheck in the docker compose file, so Vector only performs its healthcheck after Clickhouse successfully completes its own healthcheck.
vector.yaml
sources:
  file_logs:
    type: file
    include:
      - /var/log/server/*.log
    ignore_older_secs: 86400

transforms:
  parse_json:
    type: remap
    inputs:
      - file_logs
    source: |
      .parsed = parse_json!(.message)
      .timestamp = format_timestamp!(parse_timestamp!(.parsed.timestamp, "%+"), "%F %T")
      .level = .parsed.level
      .profile = .parsed.profile
      .thread = .parsed.thread
      .logger = .parsed.logger
      .message = .parsed.message
      .stack_trace = .parsed.stack_trace

sinks:
  clickhouse_sink:
    type: clickhouse
    inputs:
      - parse_json
    endpoint: http://clickhouse:8123
    database: default
    table: spring_logs
    auth:
      strategy: "basic"
      user: "default"
      password: ${CLICKHOUSE_PASSWORD}
The key part to note above is the transforms section.
It helps parse the received data and prepare it for insertion into Clickhouse.
I pushed my work to a Git repository and cloned it using the git clone command.
docker compose up -dCreate Table in Clickhouse
If Docker is running, you can access it using the command below.
docker exec -it clickhouse clickhouse-clientAnd create table using followed command.
use default;

CREATE TABLE spring_logs (
    timestamp DateTime,
    level String,
    profile String,
    thread String,
    logger String,
    message String,
    stack_trace String
) ENGINE = MergeTree()
ORDER BY timestamp;
After creating this table, Vector can sends it into this table.
Server logging with Spring boot
When I joined the team, the project was using Spring Boot and Logback for logging.
And to log in JSON format, we added the following dependency to gradle:
implementation 'net.logstash.logback:logstash-logback-encoder:7.4'https://mvnrepository.com/artifact/net.logstash.logback/logstash-logback-encoder
I chose the latest version among the most commonly used versions by referring to this link.
I created logback-spring.xml directly under the resource folder.
<configuration>
    <include resource="org/springframework/boot/logging/logback/defaults.xml"/>
    <include resource="org/springframework/boot/logging/logback/console-appender.xml"/>

    <springProperty scope="context" name="profile" source="spring.profiles.active" defaultValue="default"/>
    <springProperty scope="context" name="LOG_PATH" source="logging.file.path" defaultValue="./logs"/>

    <appender name="JSON_FILE" class="ch.qos.logback.core.rolling.RollingFileAppender">
        <file>${LOG_PATH}/json-logback.log</file>
        <rollingPolicy class="ch.qos.logback.core.rolling.SizeAndTimeBasedRollingPolicy">
            <fileNamePattern>${LOG_PATH}/json-logback-%d{yyyy-MM-dd}.%i.log</fileNamePattern>
            <maxHistory>3</maxHistory>
            <totalSizeCap>${LOG_FILE_TOTAL_SIZE_CAP:-3GB}</totalSizeCap>
            <cleanHistoryOnStart>${LOG_FILE_CLEAN_HISTORY_ON_START:-false}</cleanHistoryOnStart>
            <maxFileSize>${LOG_FILE_MAX_SIZE:-10MB}</maxFileSize>
        </rollingPolicy>
        <encoder class="net.logstash.logback.encoder.LogstashEncoder">
            <fieldNames>
                <timestamp>timestamp</timestamp>
                <level>level</level>
                <thread>thread</thread>
                <logger>logger</logger>
                <message>message</message>
                <fieldName name="profile" value="${profile}" />
            </fieldNames>
        </encoder>
    </appender>

    <springProfile name="local">
        <root level="DEBUG">
            <appender-ref ref="CONSOLE" />
        </root>
        <include resource="org/springframework/boot/logging/logback/base.xml"/>
    </springProfile>

    <springProfile name="prod">
        <root level="INFO">
            <appender-ref ref="JSON_FILE" />
        </root>
    </springProfile>
</configuration>
First, you need to look at the springProperty named LOG_PATH.
Since /var/log doesn't exist in the local environment and would throw an error, you need to configure it separately in application-local and application-prod.
# local
logging:
  file:
    path: ./logs

# prod
logging:
  file:
    path: /var/log/server
To add some explanation, Spring has a profile system where you can use the application-(profile) format.
SizeAndTimeBasedRollingPolicy means that when a log file becomes too large or too old, it automatically splits the existing log file according to certain conditions.
Also, I made sure that the logging matches the settings we configured in vector above.
Setting up Grafana Server (Optional)
I want to use it in the form of grafana.domain.com.
I purchased a domain from Cloudflare and added it as follows:
Type: A
Name: grafana
Content: <IP Address>
Proxy status: DNS only
TTL: Auto
If you set it to DNS only, Cloudflare will automatically redirect the request to your server.
Nginx
In my case, I used Nginx to serve requests, so I set it up as shown below.
nano /etc/nginx/conf.d/default.conf

# conf file
server {
    listen 443 ssl;
    server_name grafana.sena.gg;

    include /etc/letsencrypt/options-ssl-nginx.conf;
    ssl_dhparam /etc/letsencrypt/ssl-dhparams.pem;

    location / {
        proxy_pass http://localhost:3030/;
        proxy_set_header Host $host;
        proxy_set_header X-Real-IP $remote_addr;
        proxy_set_header X-Forwarded-For $proxy_add_x_forwarded_for;
        proxy_set_header X-Forwarded-Proto $scheme;

        auth_basic "Restricted";
        auth_basic_user_file /etc/nginx/.htpasswd;
    }
}
As you can see, port 443 is used for HTTPS, so you’ll need to set up an SSL certificate.
sudo certbot --nginx -d grafana.domain.comChange the domain above to your own domain to create an SSL certificate.
This will automatically add SSL-related settings to nginx.
For additional security, I set up login authentication.
I already had a security file created previously, so I applied it directly.
Reference) https://junlog.dev/blog/setting-up-netdata/
You can refer to the section about creating login accounts in Ubuntu.
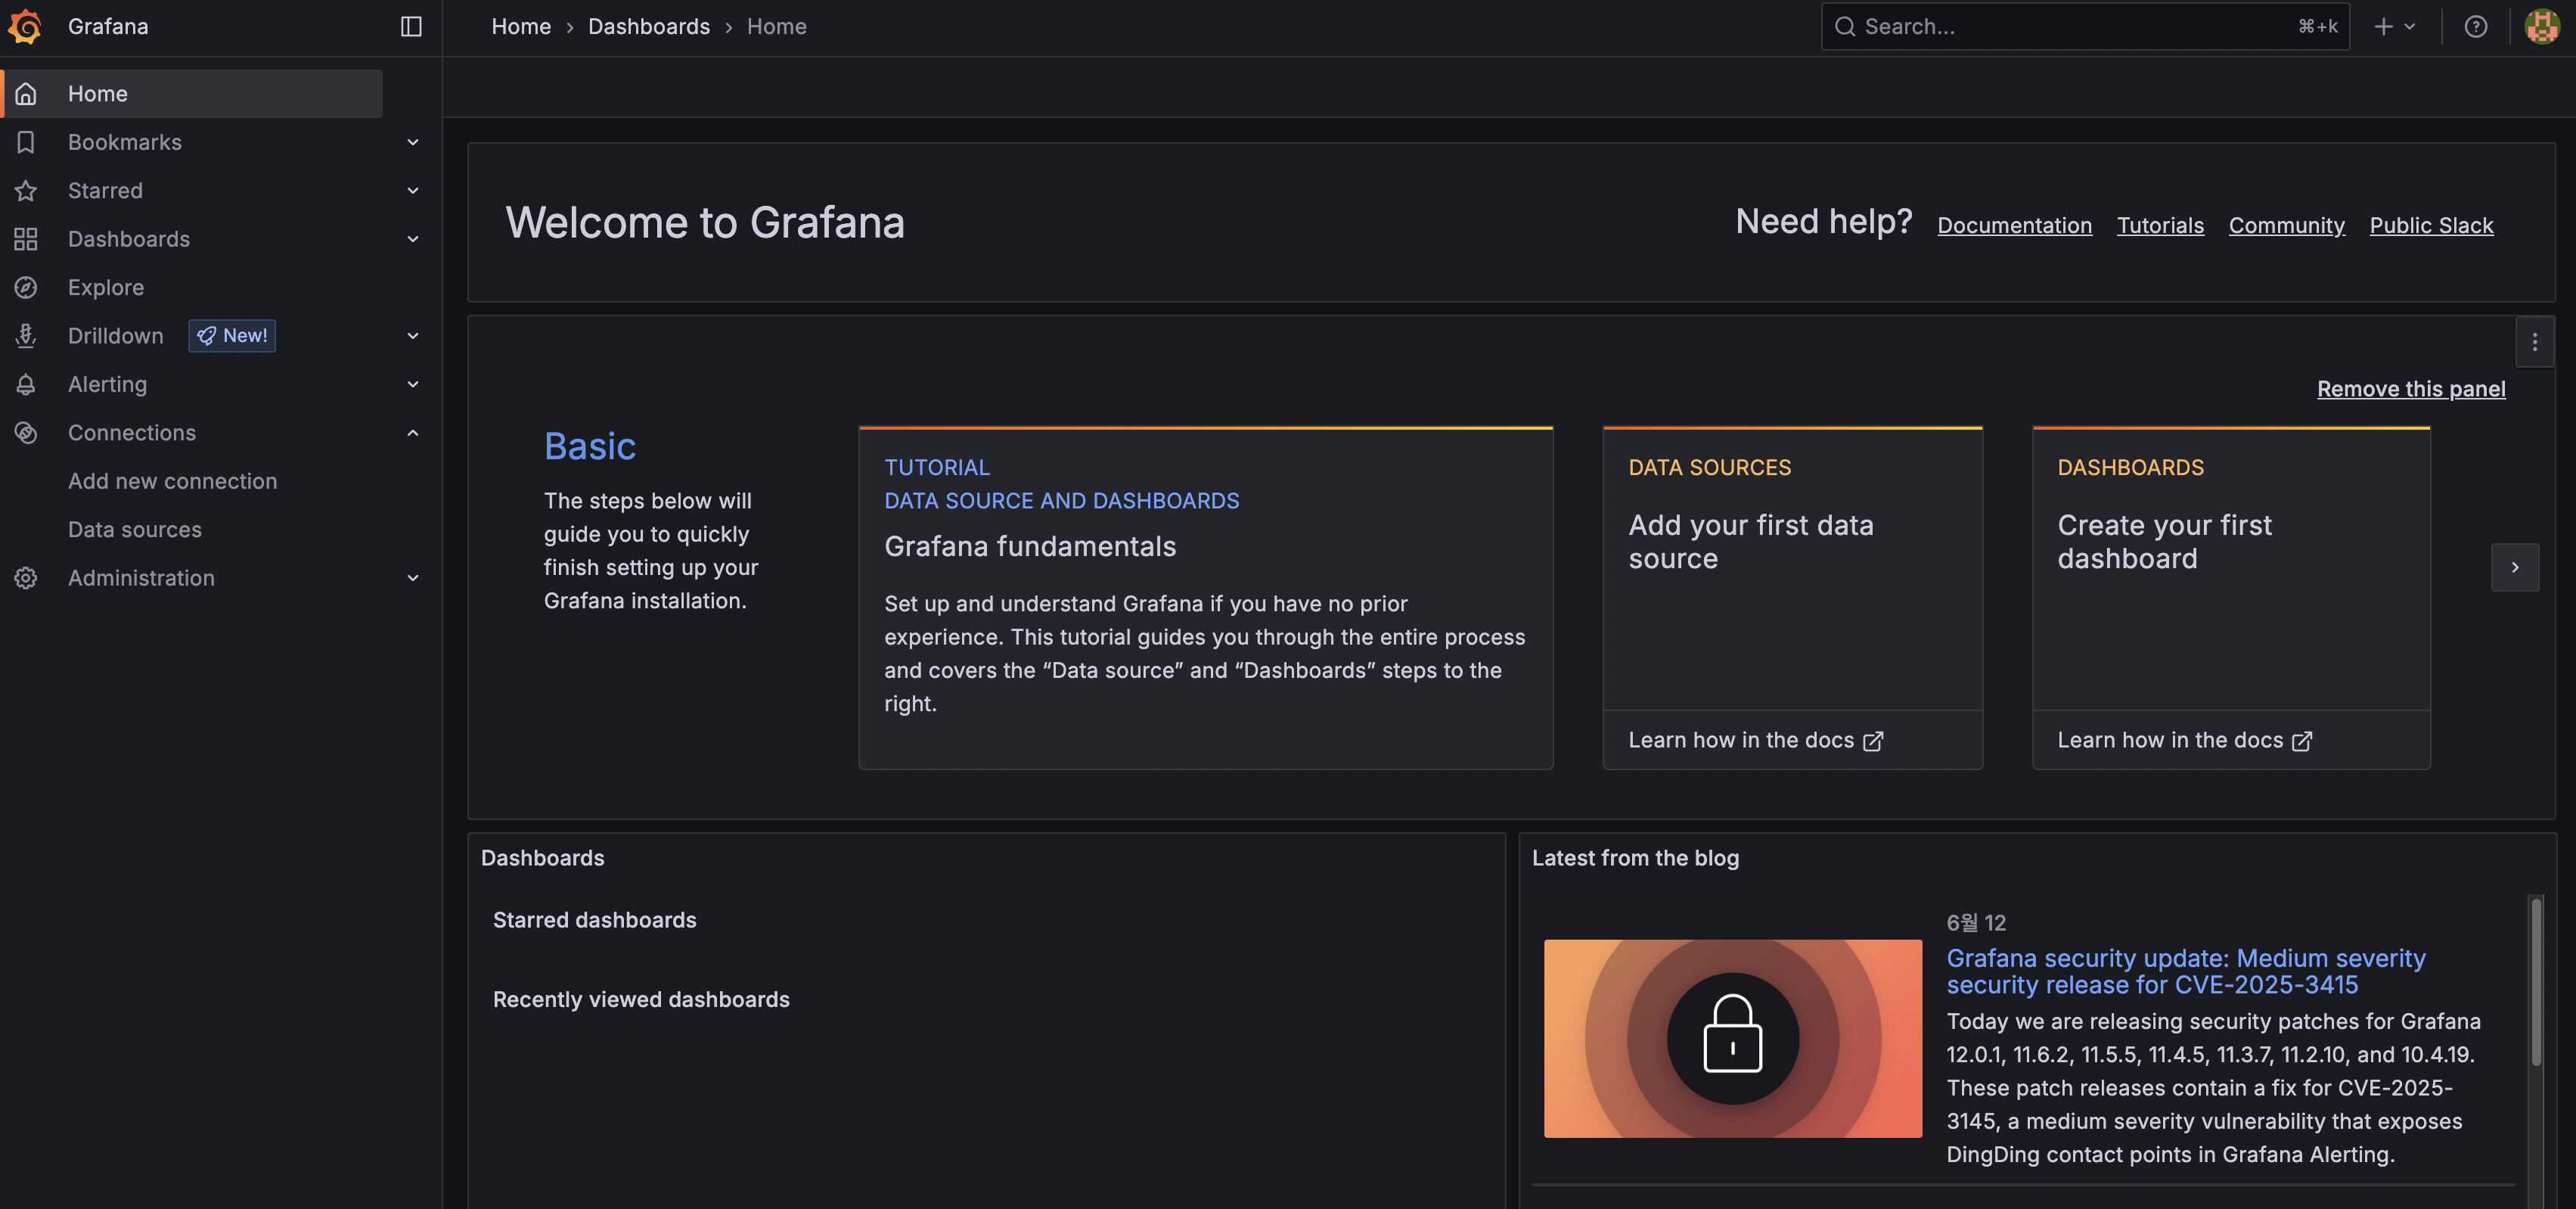
When you access Grafana, a login screen will appear. The initial username and password are both "admin".
After logging in, you'll be able to see the page as shown below.
Setting up Clickhouse Plugin in Grafana
Since Clickhouse is not available by default in Grafana's Data Sources, we need to install it as follows.
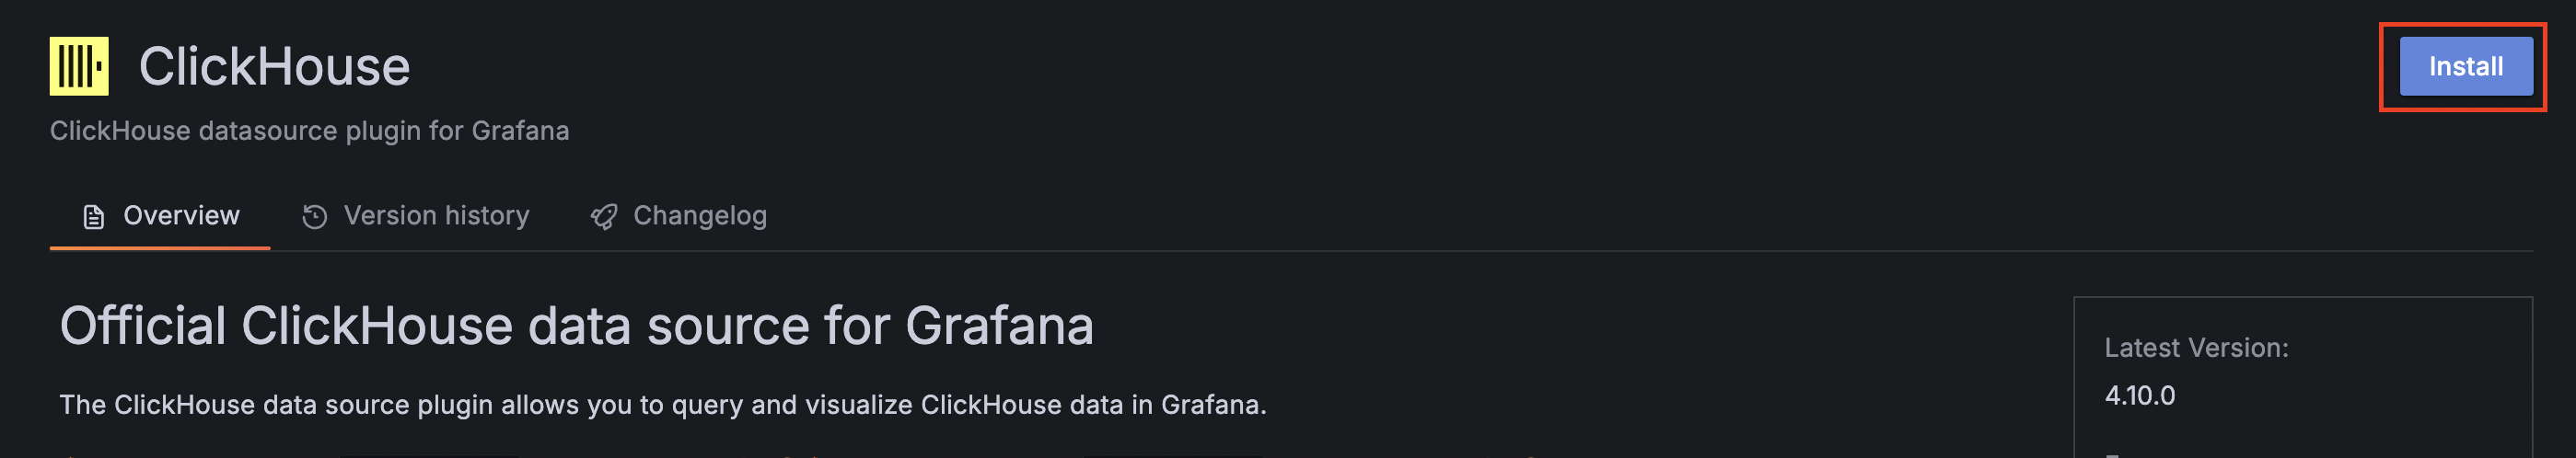
Go to Administration -> Plugins and Data -> Plugin.
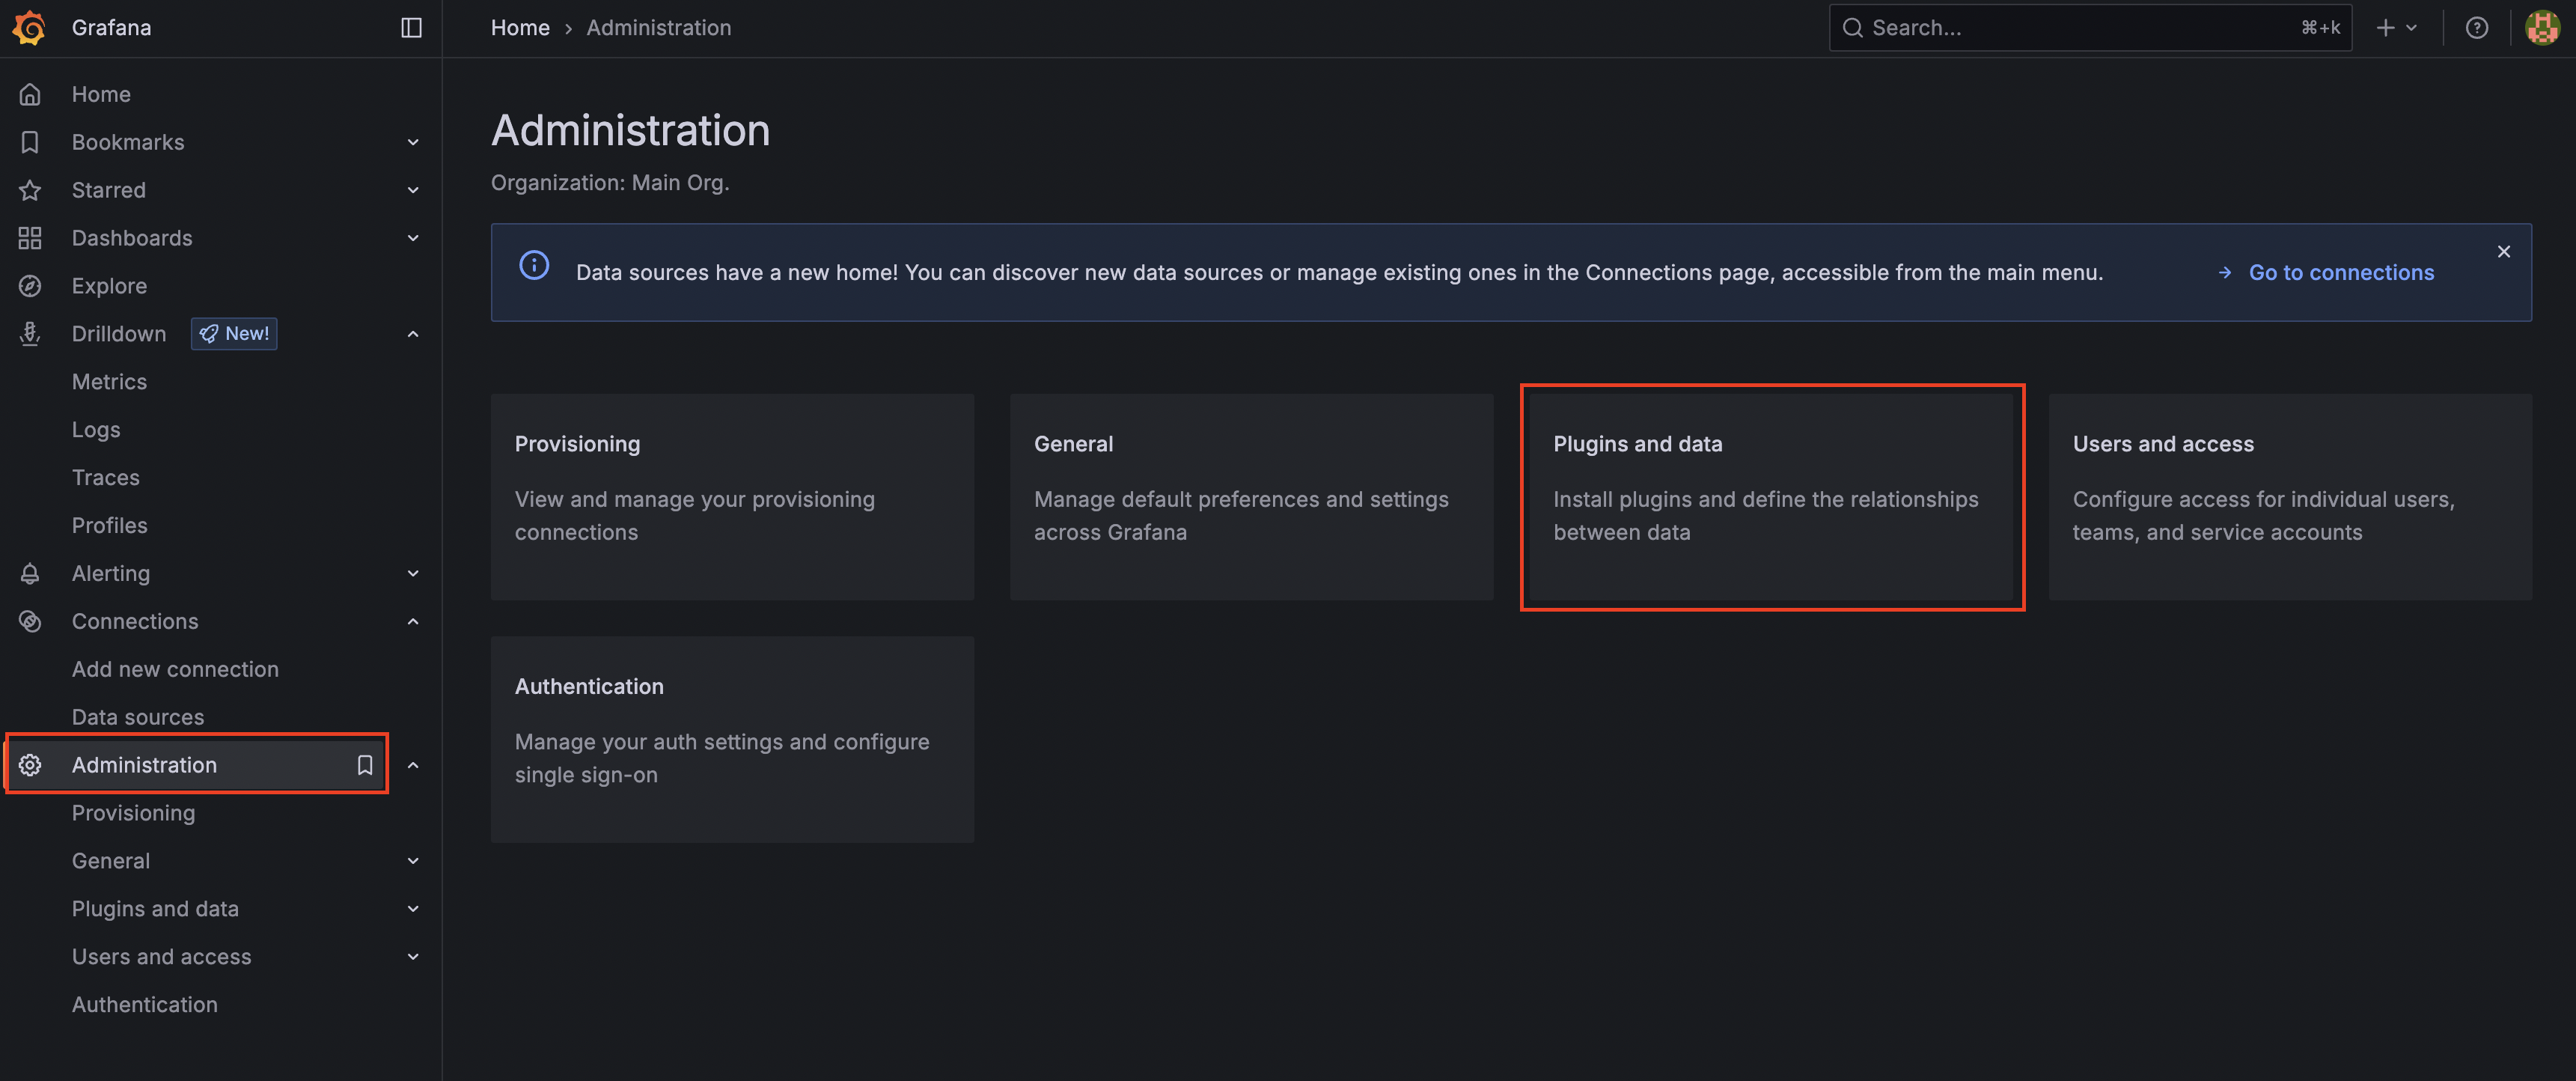
Then search for Clickhouse and click the install button.
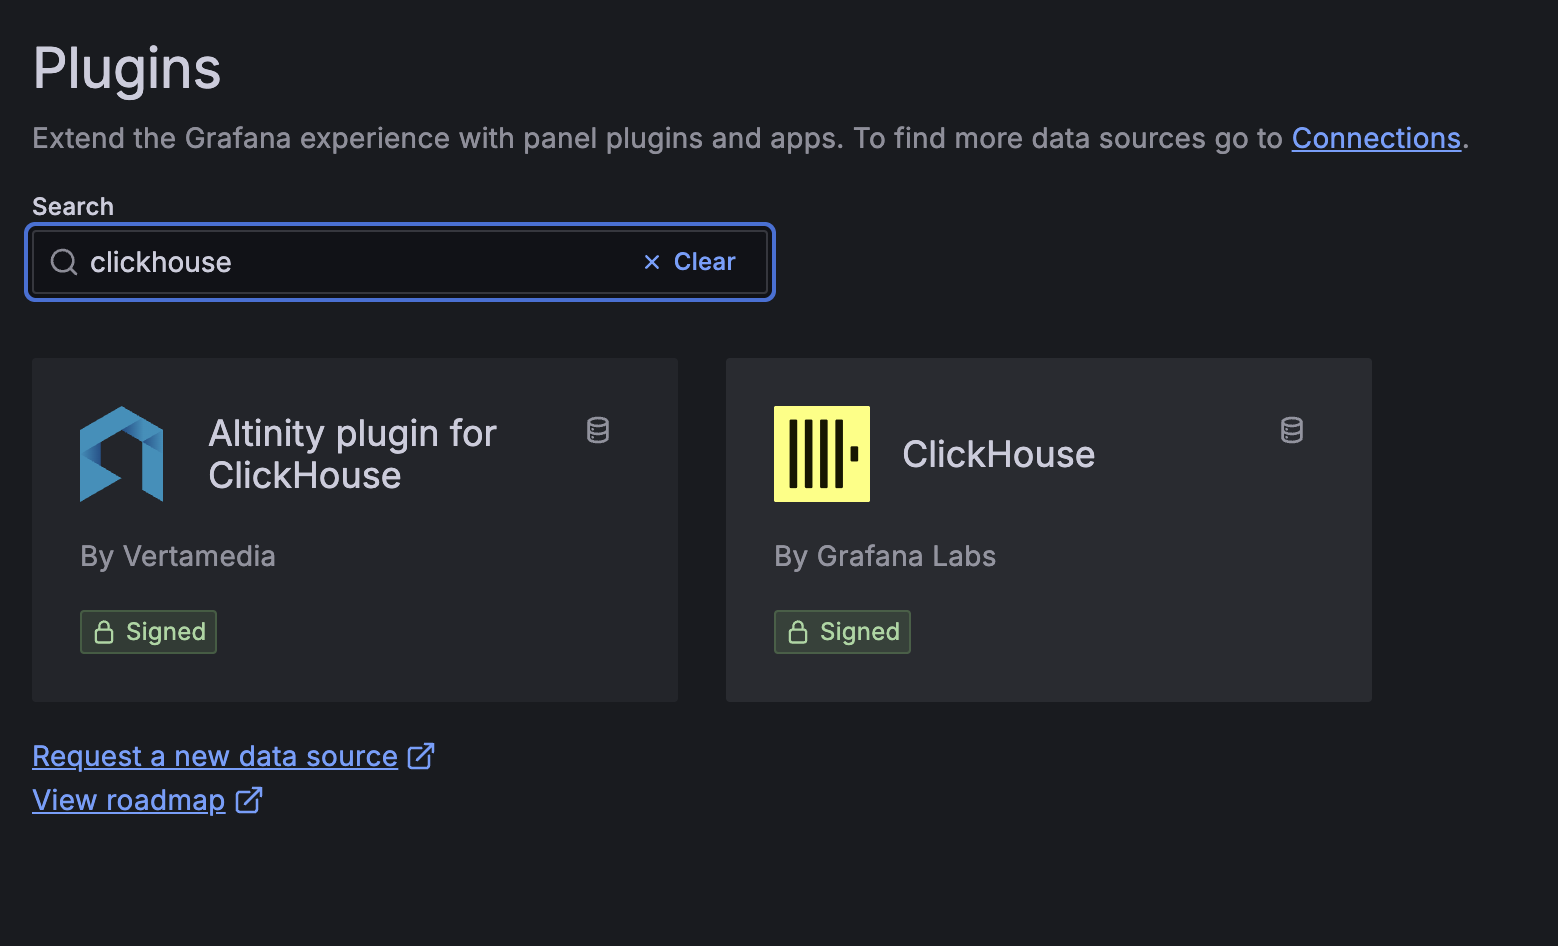
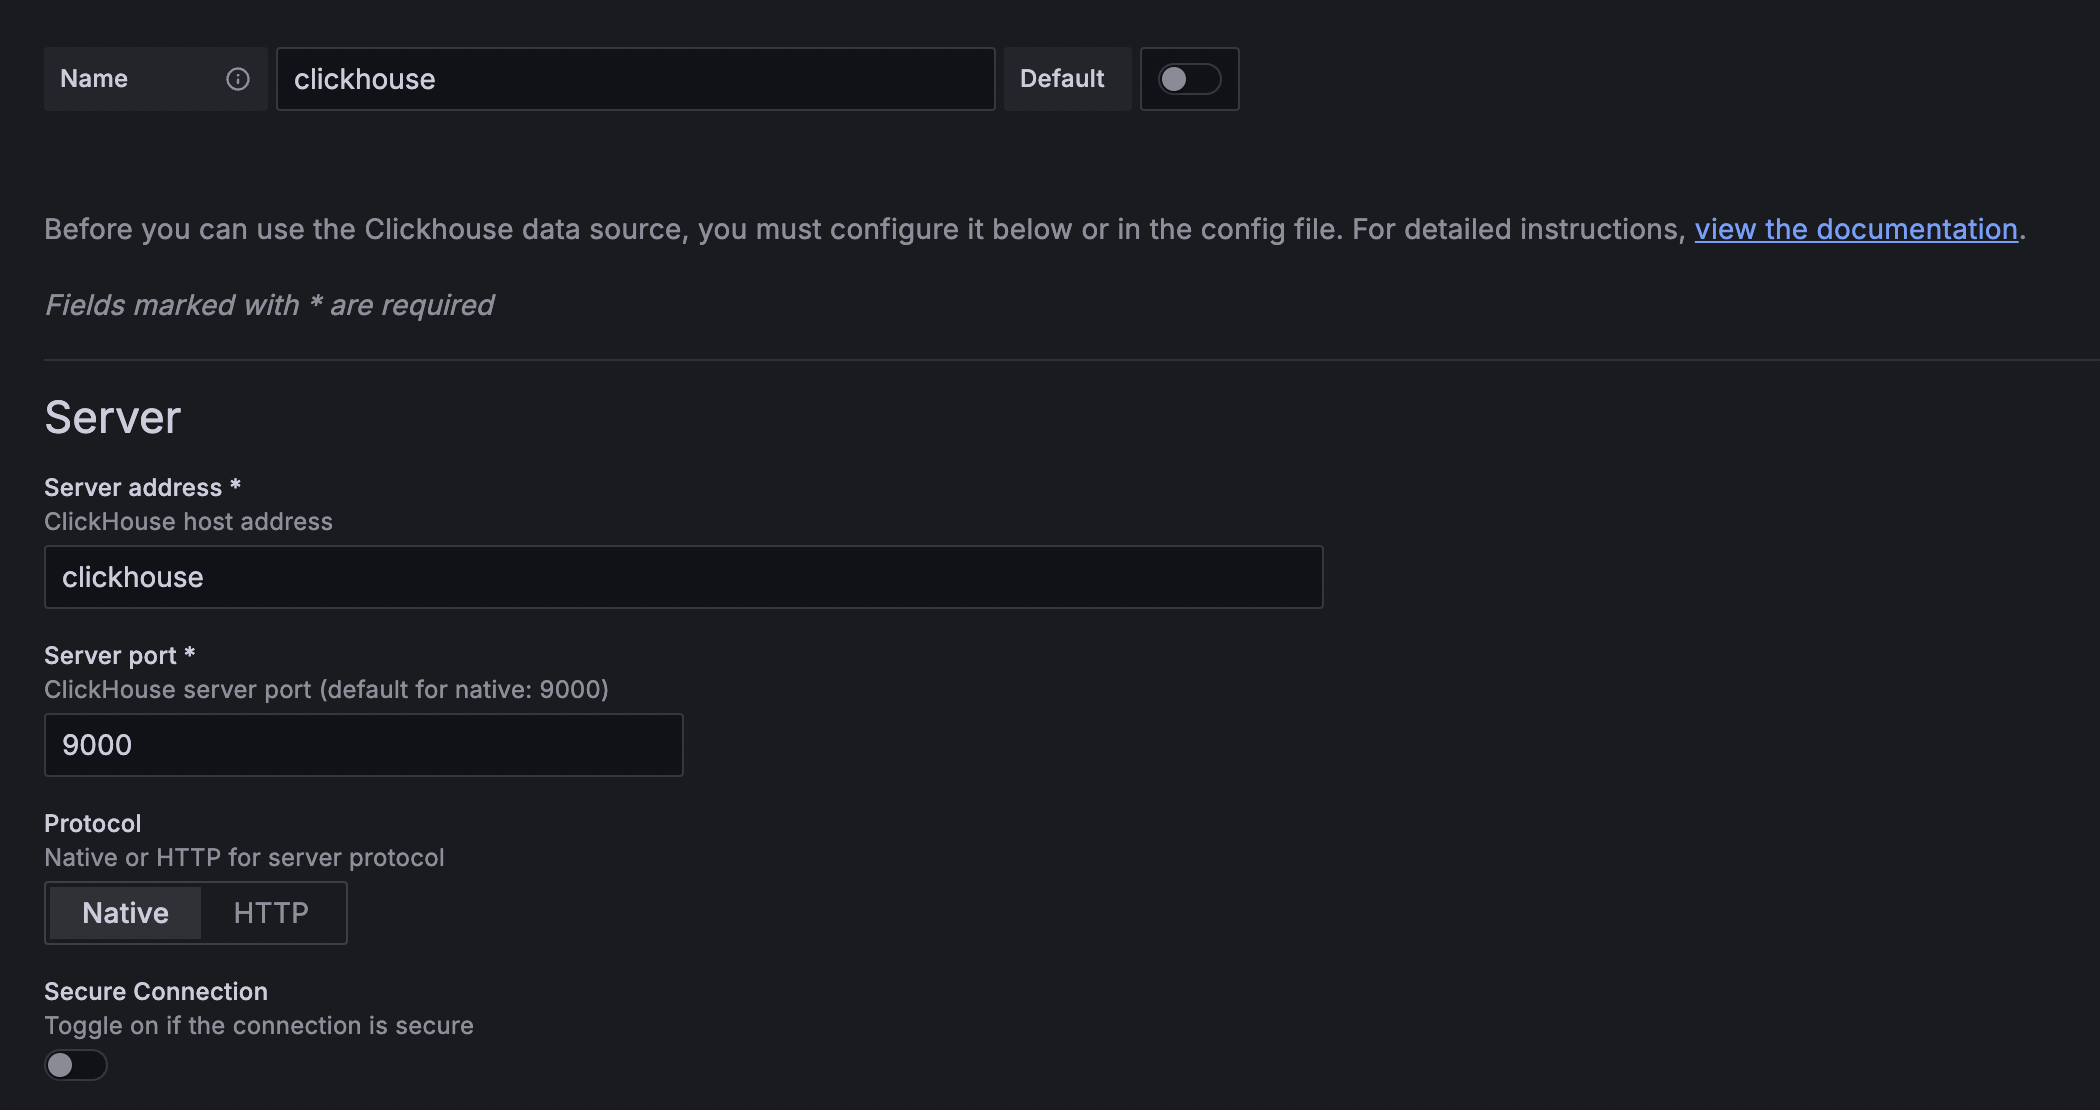
Once the installation is complete, click add datasources to proceed with Clickhouse setup.
For the password, enter the same password you set in your env file.
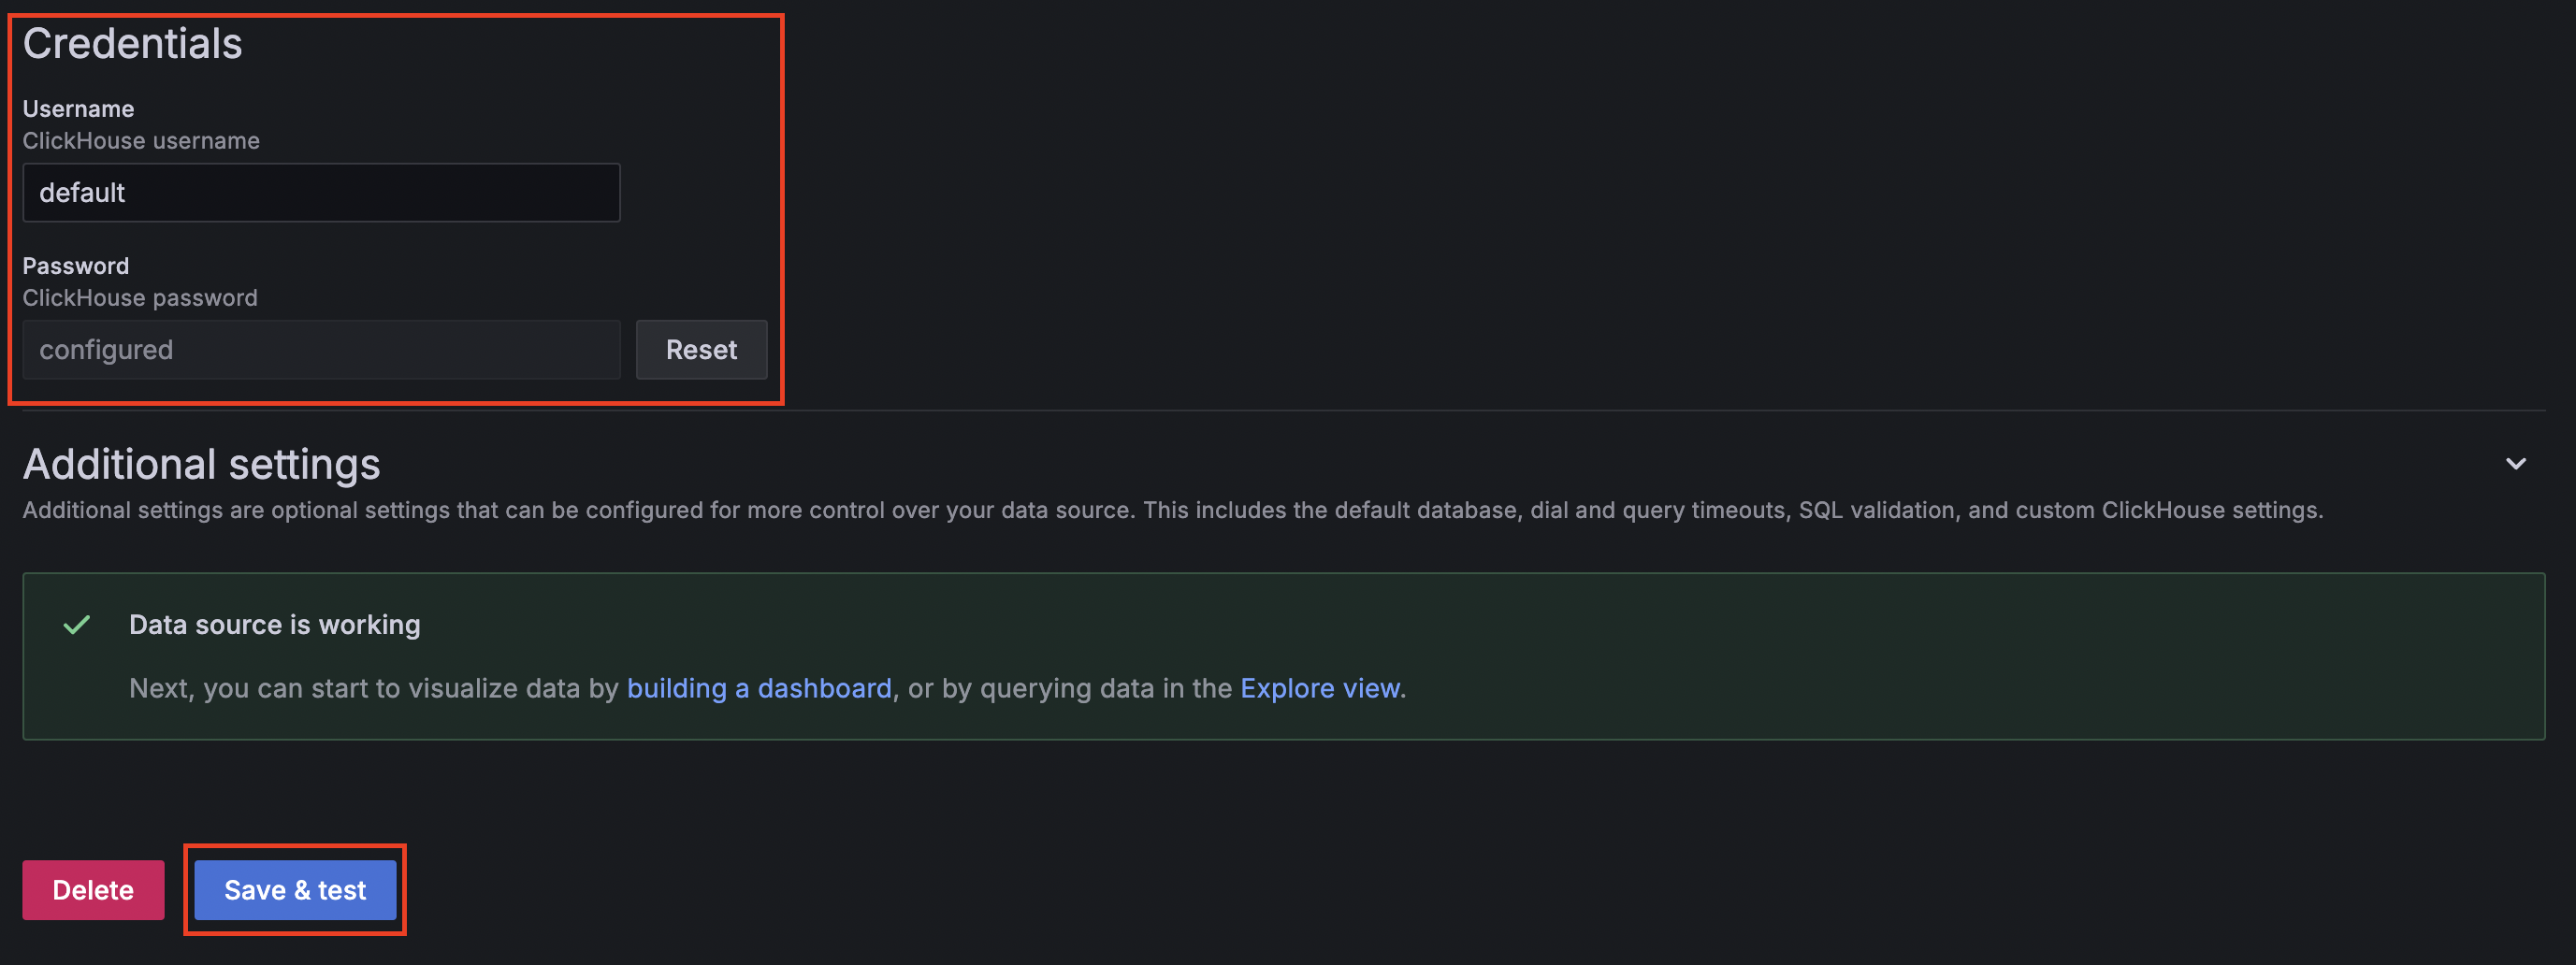
When you see a green checkmark like above, the setup has been completed successfully.
Testing
Now that the setup is complete, it's time to create a dashboard and verify that everything is working properly.
Testing in Spring Boot
For testing purposes, I created info and error endpoints on the server.
public void info() {
  log.info("test");
}
public void error() {
    try {
        throw new RuntimeException("error test");
    } catch (Exception e) {
        log.error("error", e);
    }
}
Then now You can see the log below.
...
{"timestamp":"2025-06-16T11:39:44.709+0900","logger_name":"com.test.service.MainService","level":"INFO","thread":"http-nio-8080-exec-1","logger":"com.test.service.MainService","message":"test"}
{"timestamp":"2025-06-16T11:54:20.345+0900","logger_name":"com.test.service.MainService","level":"ERROR","thread":"http-nio-8080-exec-2","logger":"com.test.service.MainService","message":"errorjava.lang.RuntimeException: error test\n\tat com.test.service.MainService.error(MainService.java:16)\n\tat com.test.controller.MainController.error(MainController.java:62)~"}
Checking in Grafana
If the logging was successful above, Vector should have sent the data to Clickhouse properly.
You can check this in the Grafana dashboard or explore section.
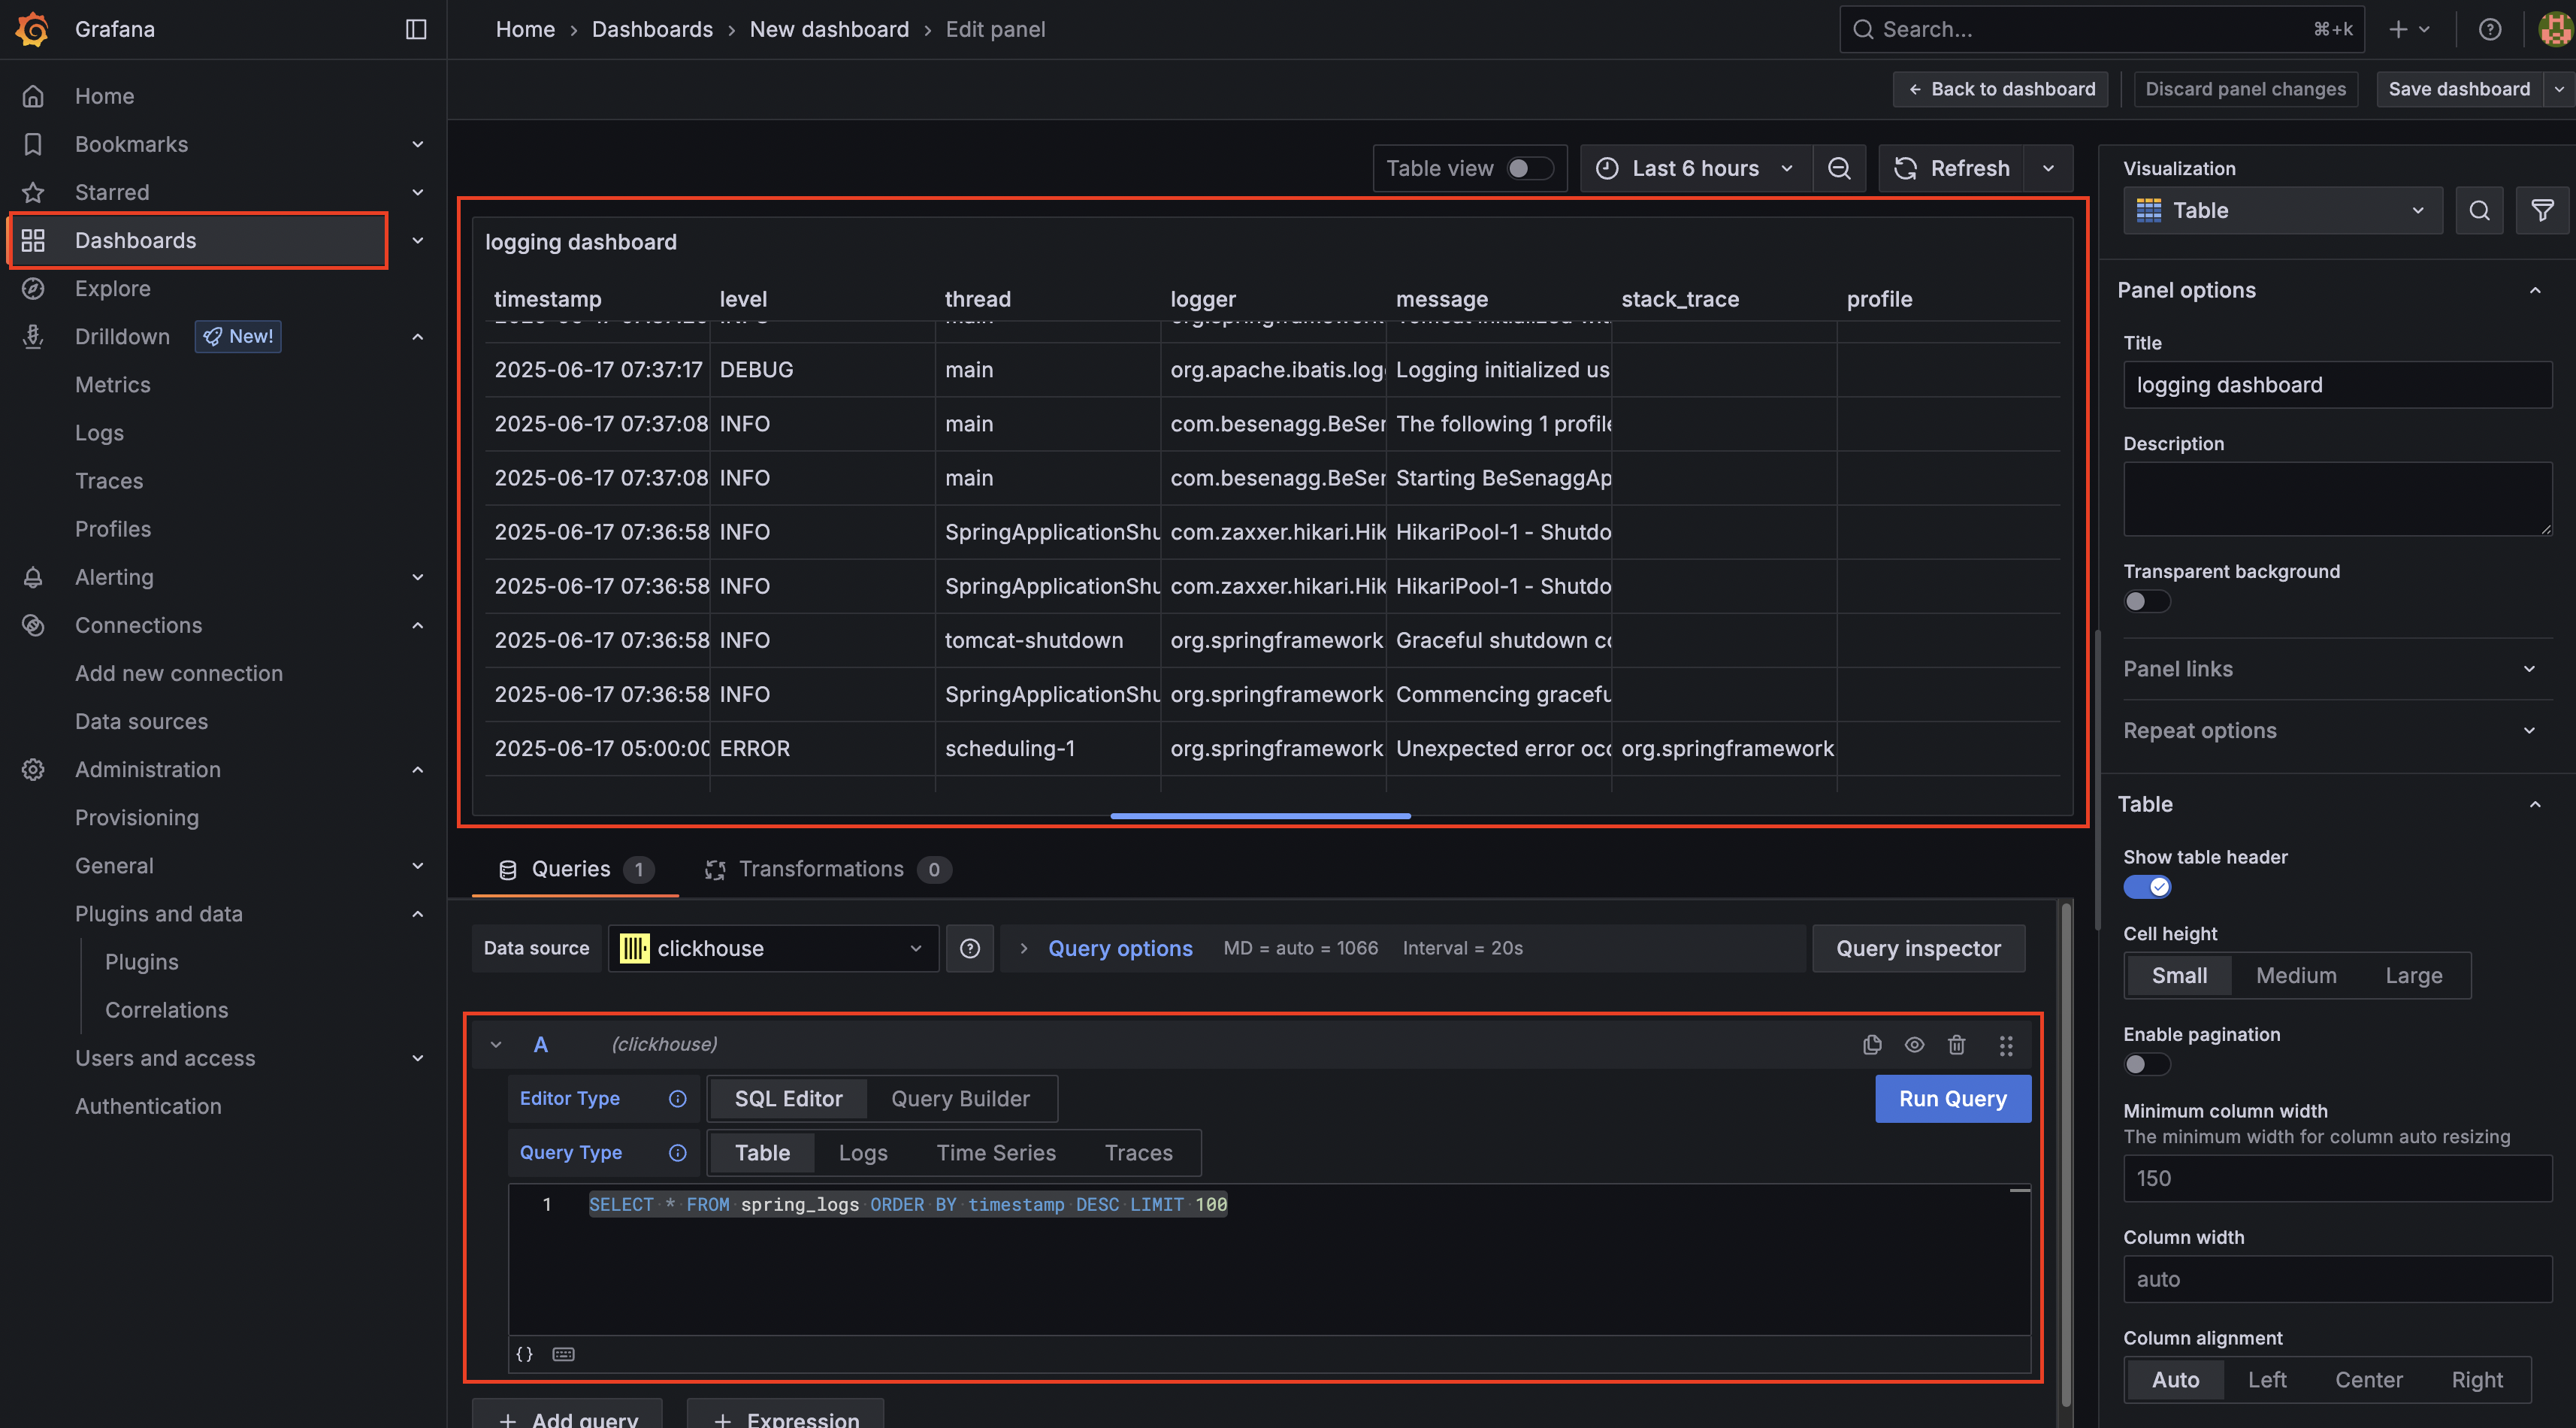
This completes the setup.
In the next post, we'll continue by setting up Slack alerts using Grafana.
Share this post
Comments (0)
No comments yet. Be the first to comment!