Receiving Slack Notifications for Errors using Grafana
June 18, 2025
Why Log Alerts are Important
In a previous post, we set up a log server and successfully monitored error logs.
However, it's practically impossible to continuously monitor error logs by directly accessing Grafana.
Therefore, we need to set up alerts to be notified when errors occur.
This functionality exists in Grafana, so let's use our previously configured Grafana setup.
Setting up Slack
https://api.slack.com/messaging/webhooks
First, visit the link above and follow the documentation to create a webhook as shown in the image.
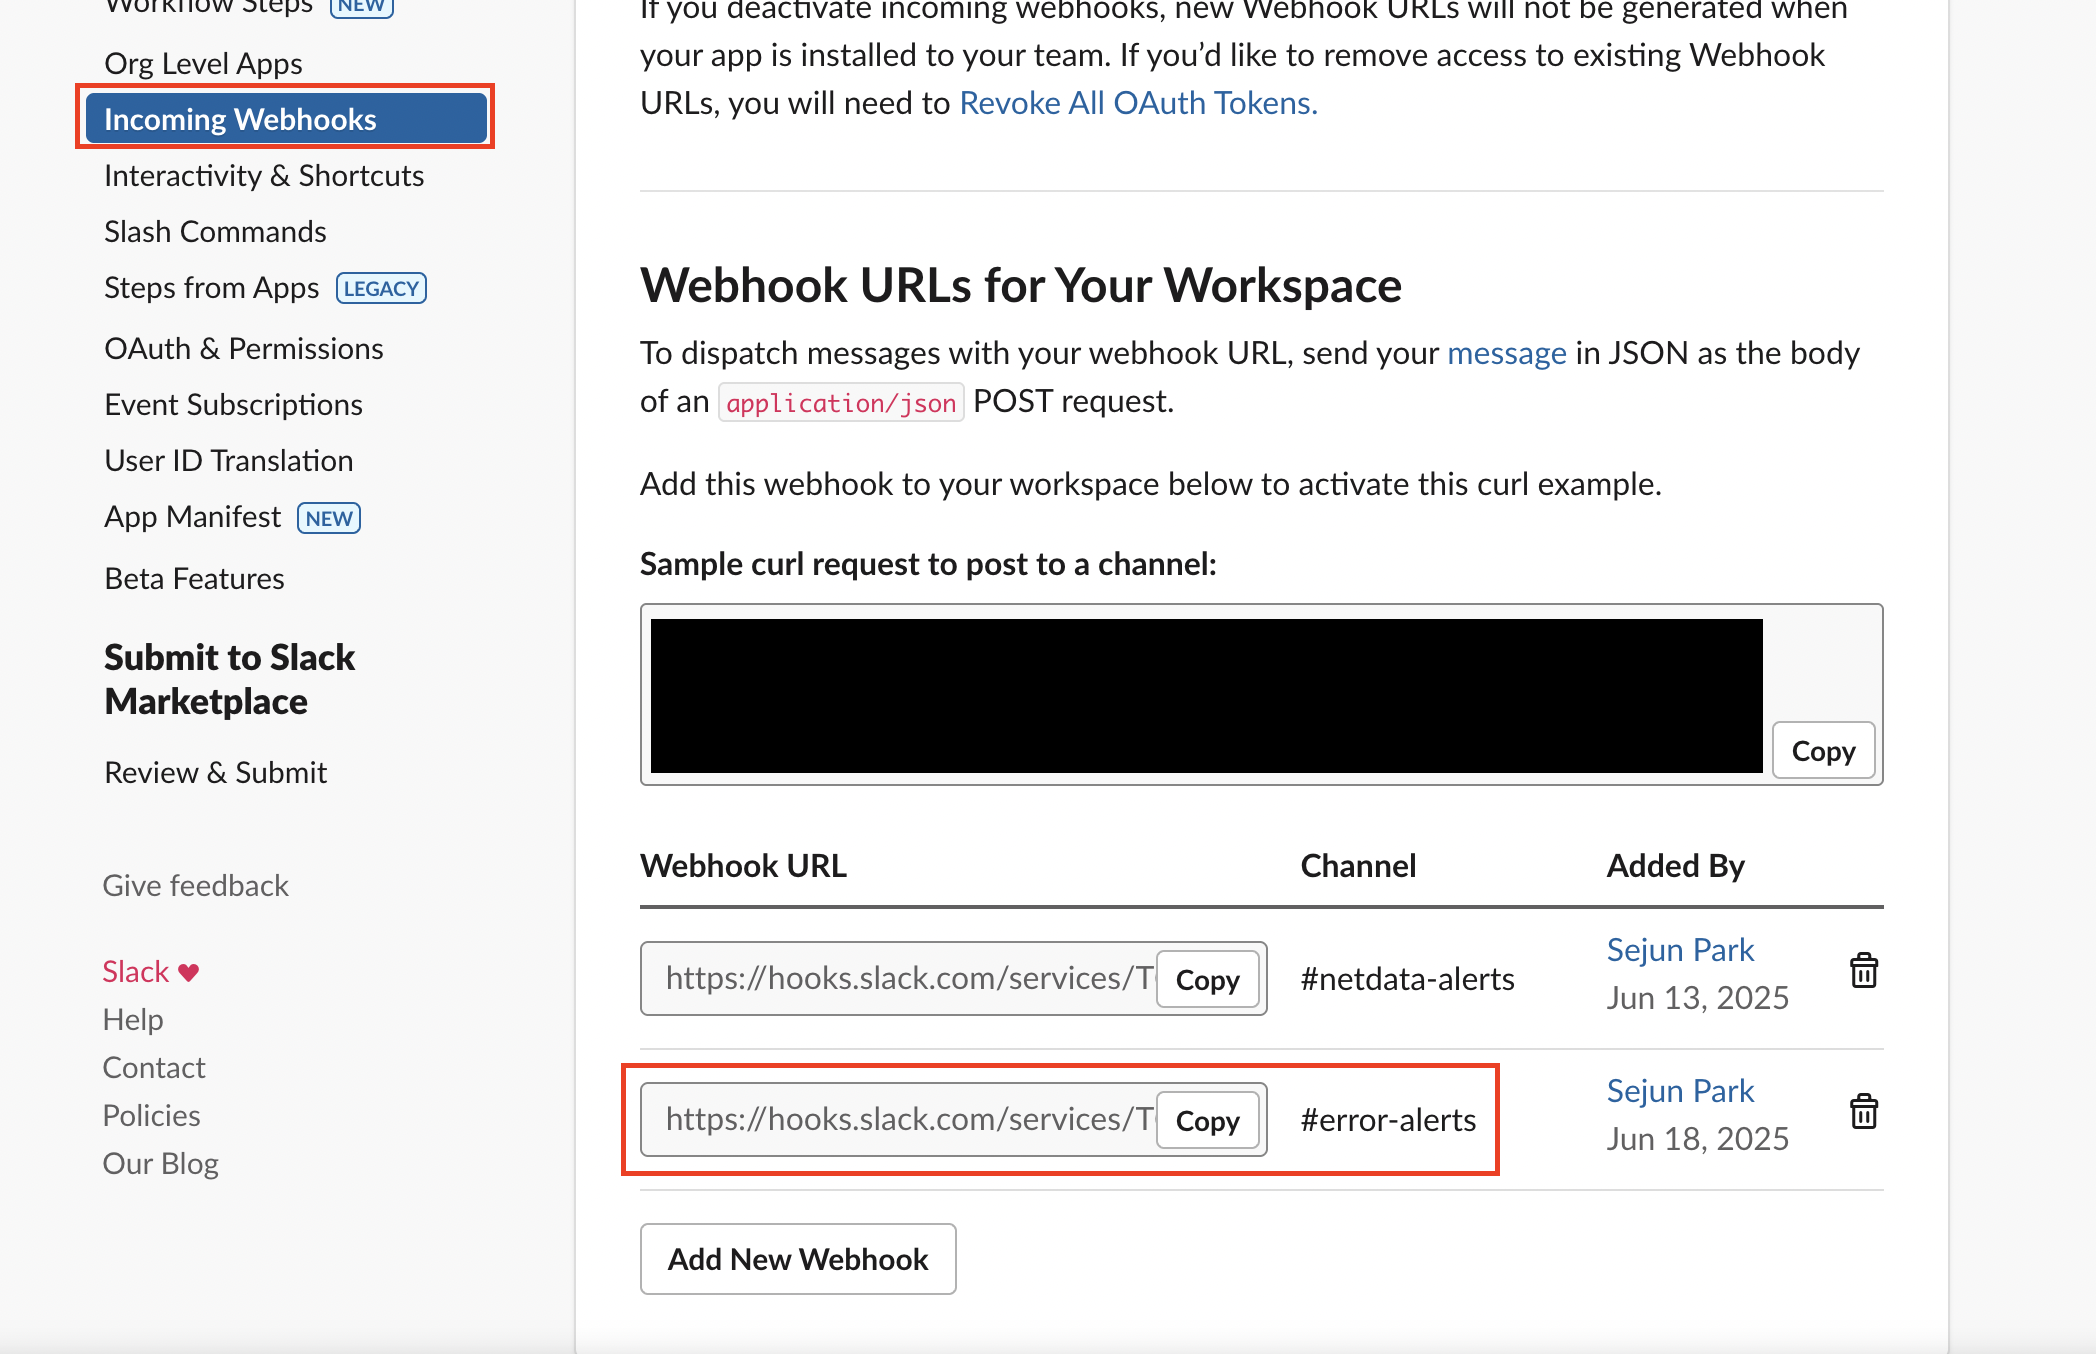
We'll use this Webhook URL for Grafana Alerting in the next steps.
Setting up Grafana Dashboard
First, let's create an error-related dashboard in Grafana so we can easily check when errors occur.
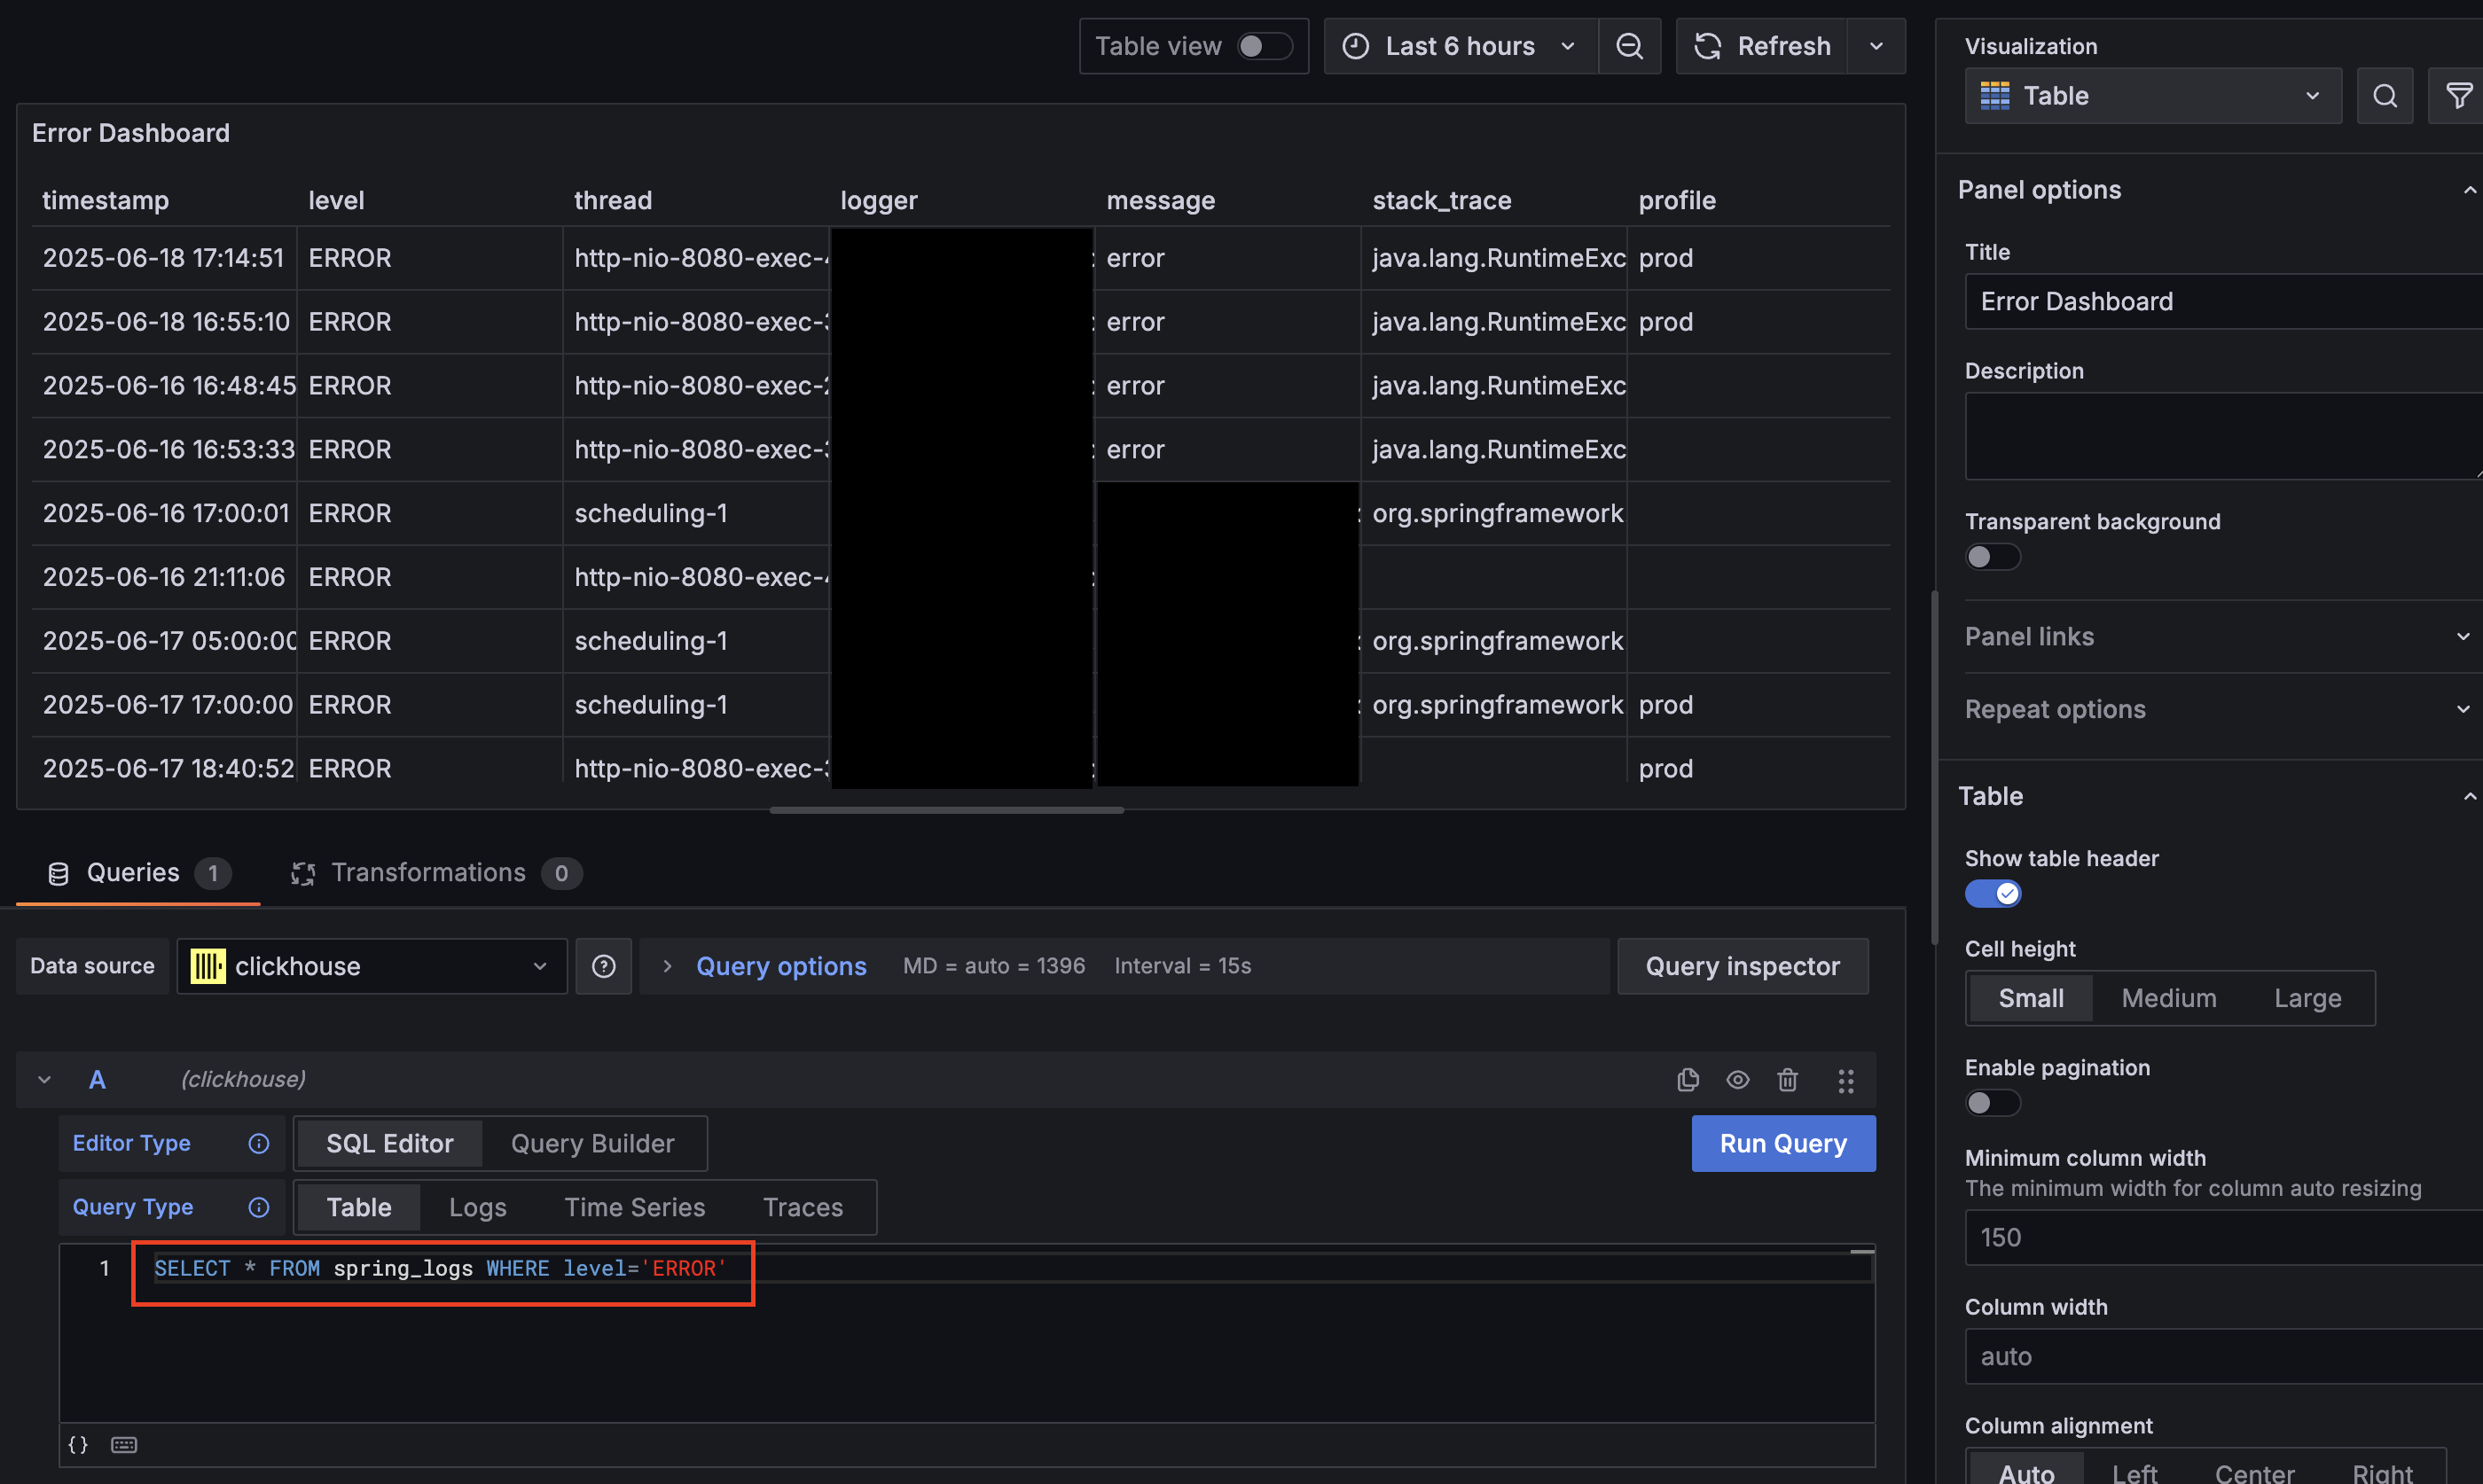
Simply configure the query to show only errors as shown above. We'll need to copy this URL for later use.
Setting up Contact Points
Contact points are part of Alerting, and this is where you configure where alerts will be sent when an error occurs.
Click the Create button to add a new Contact point.
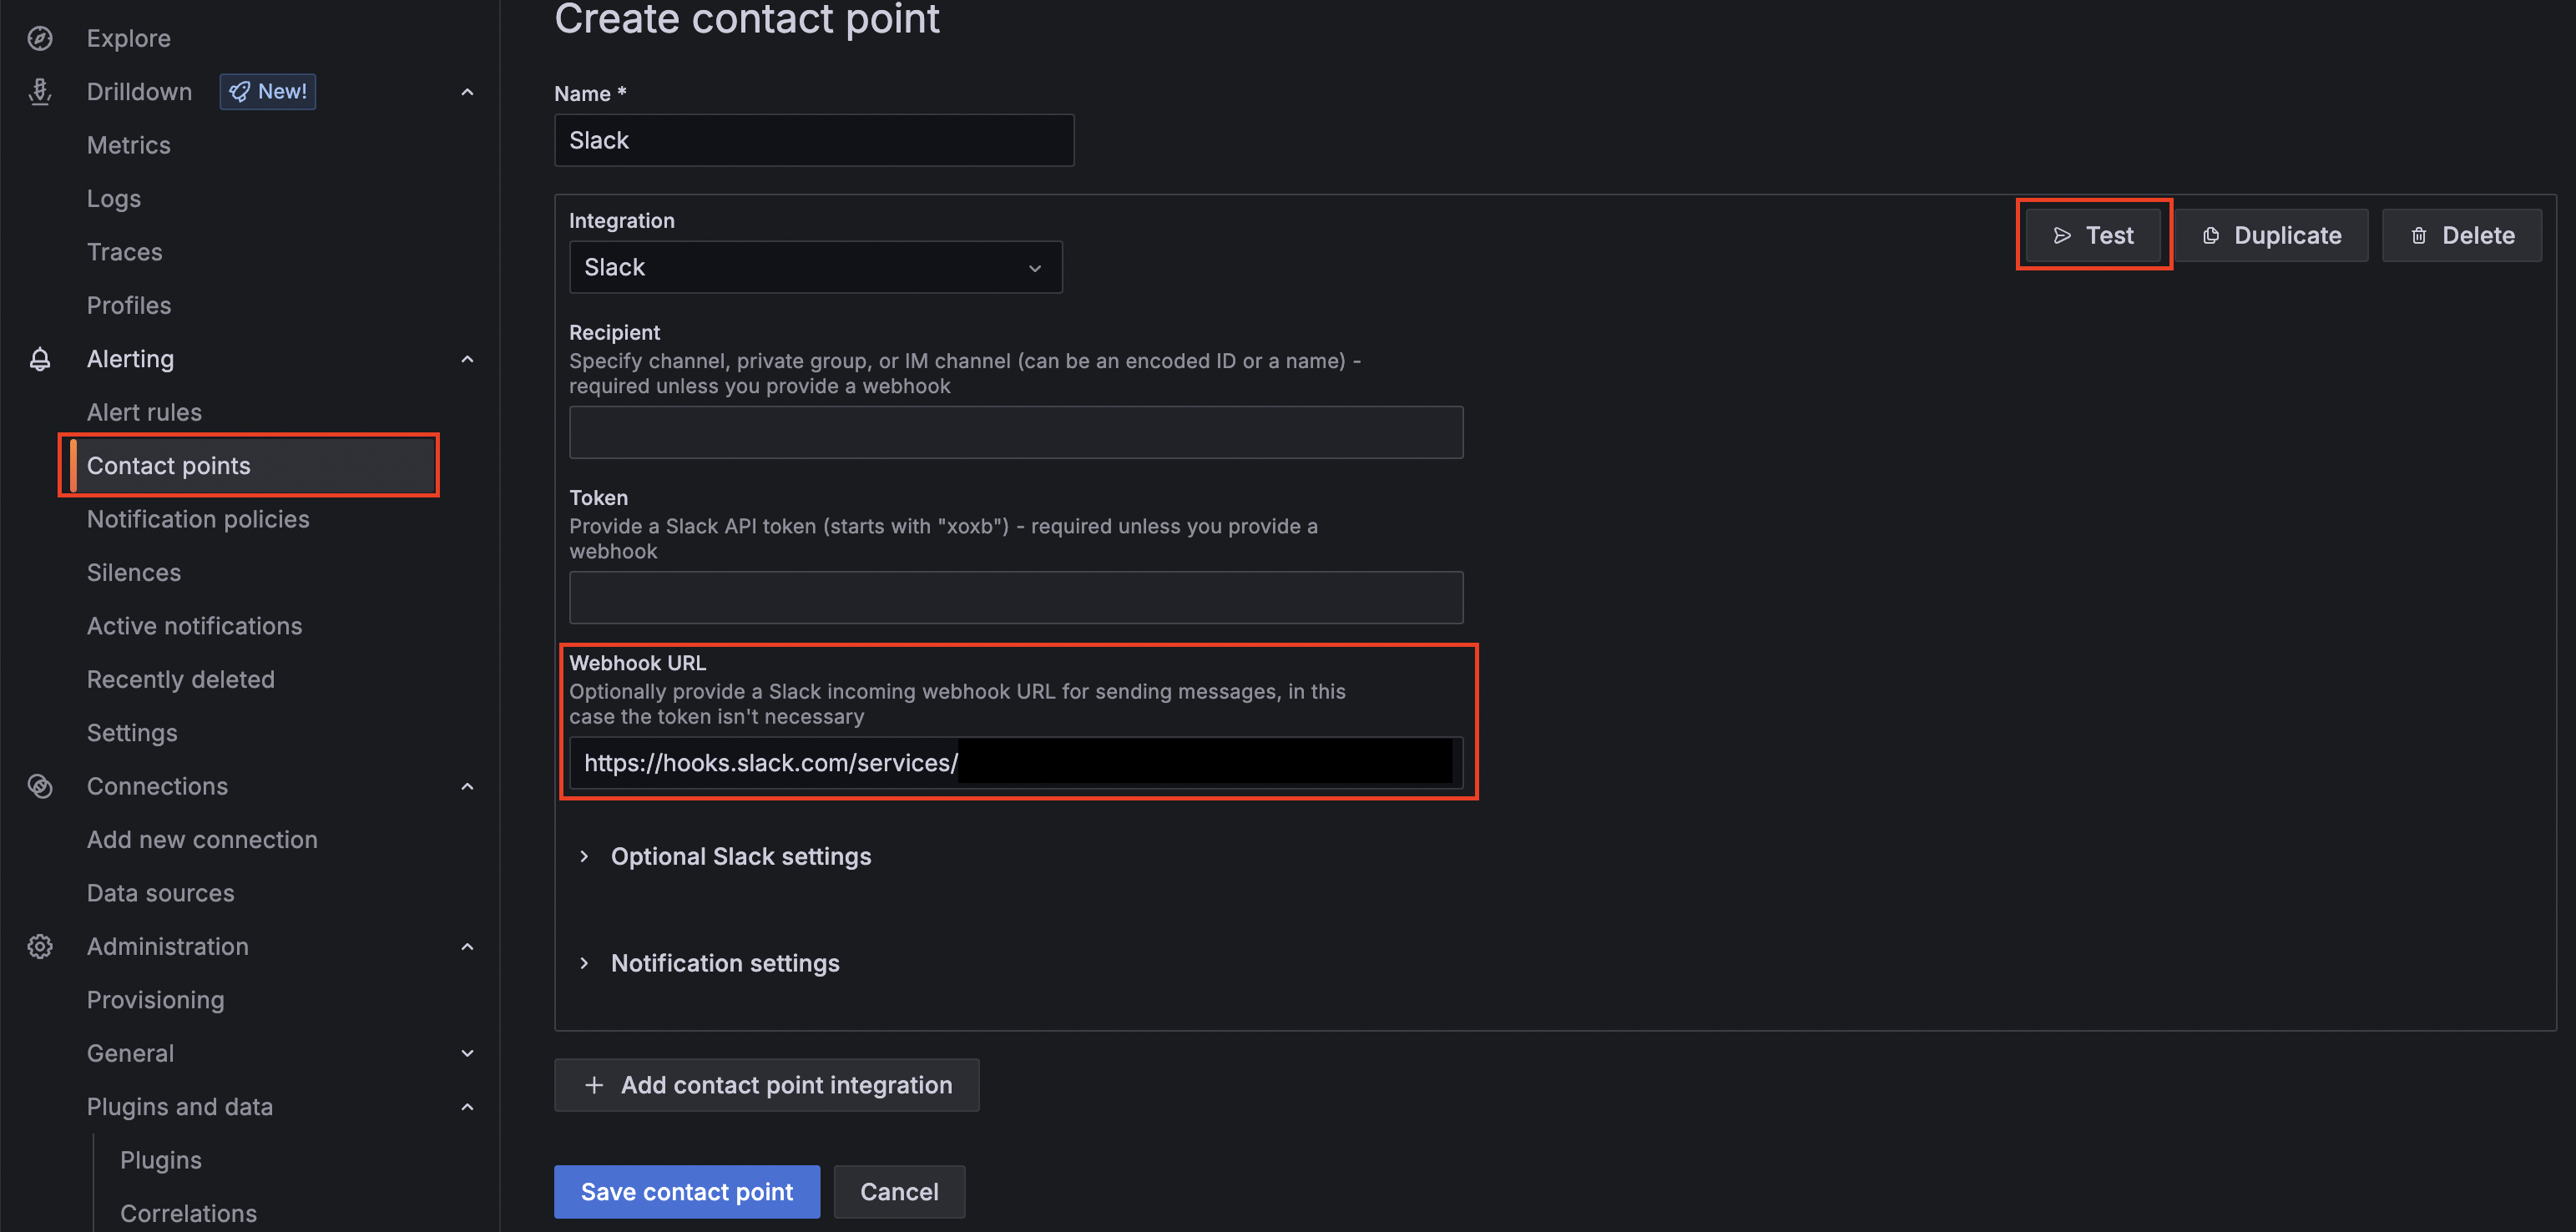
When you see the screen above, configure the settings as follows:
- Integration: Slack
- Webhook URL: Previously obtained Webhook URL
After configuring these settings, click the Test button to verify that the message is properly delivered to Slack.
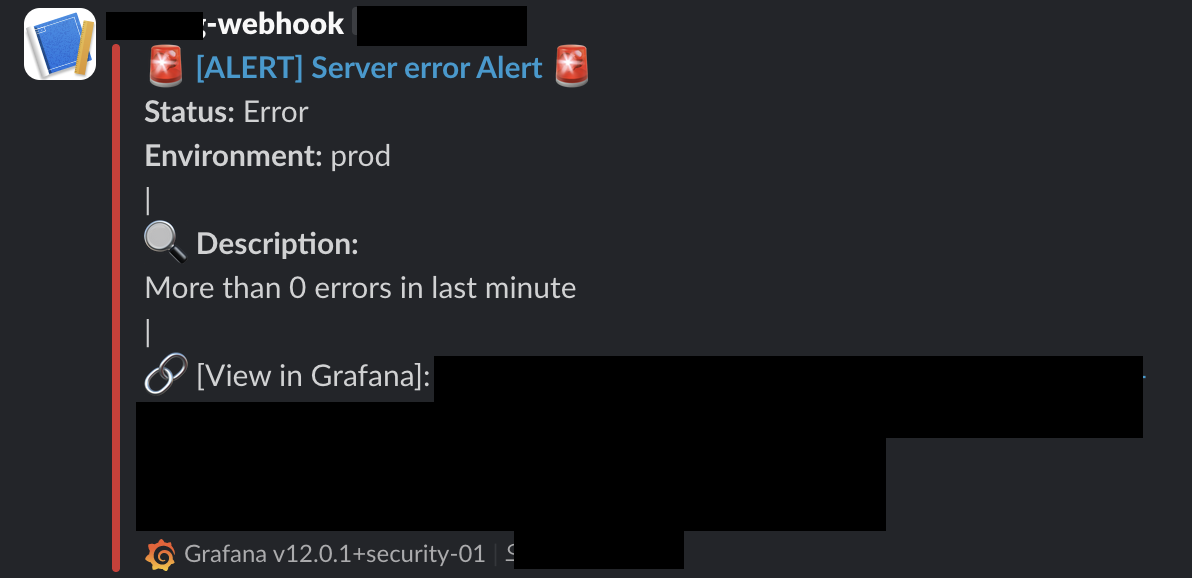
Additionally, I configured the Title and Text Body in the Optional Slack settings as follows:
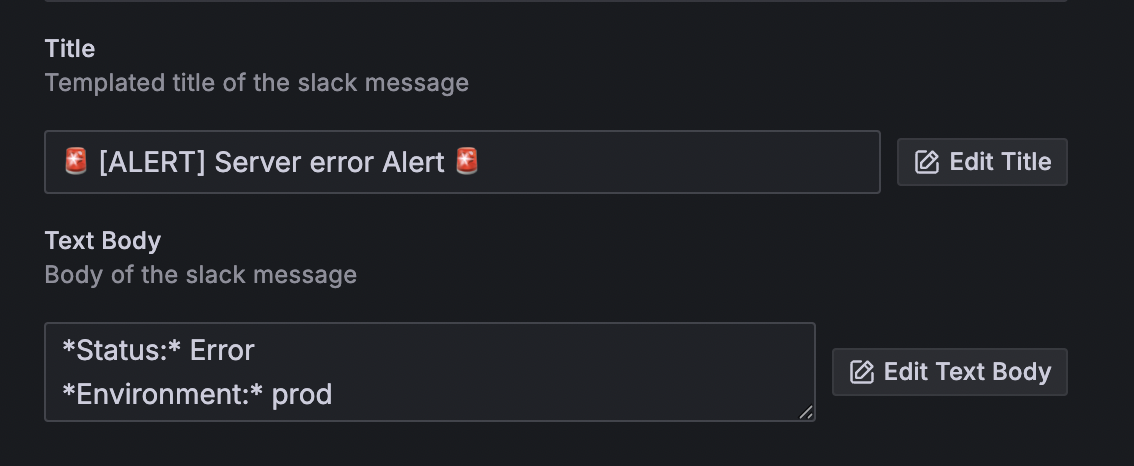
# title
🚨 [ALERT] Server error Alert 🚨

# Text Body
*Status:* Error
*Environment:* prod
|
🔍 *Description:*
More than 0 errors in last minute
|
🔗 [View in Grafana]: <Error Dashboard URL>
After testing, you should see that the message is delivered successfully, as shown below.
Setting Up Alert Rule
Now let's set up the Alert Rule. I'll explain each step with screenshots.
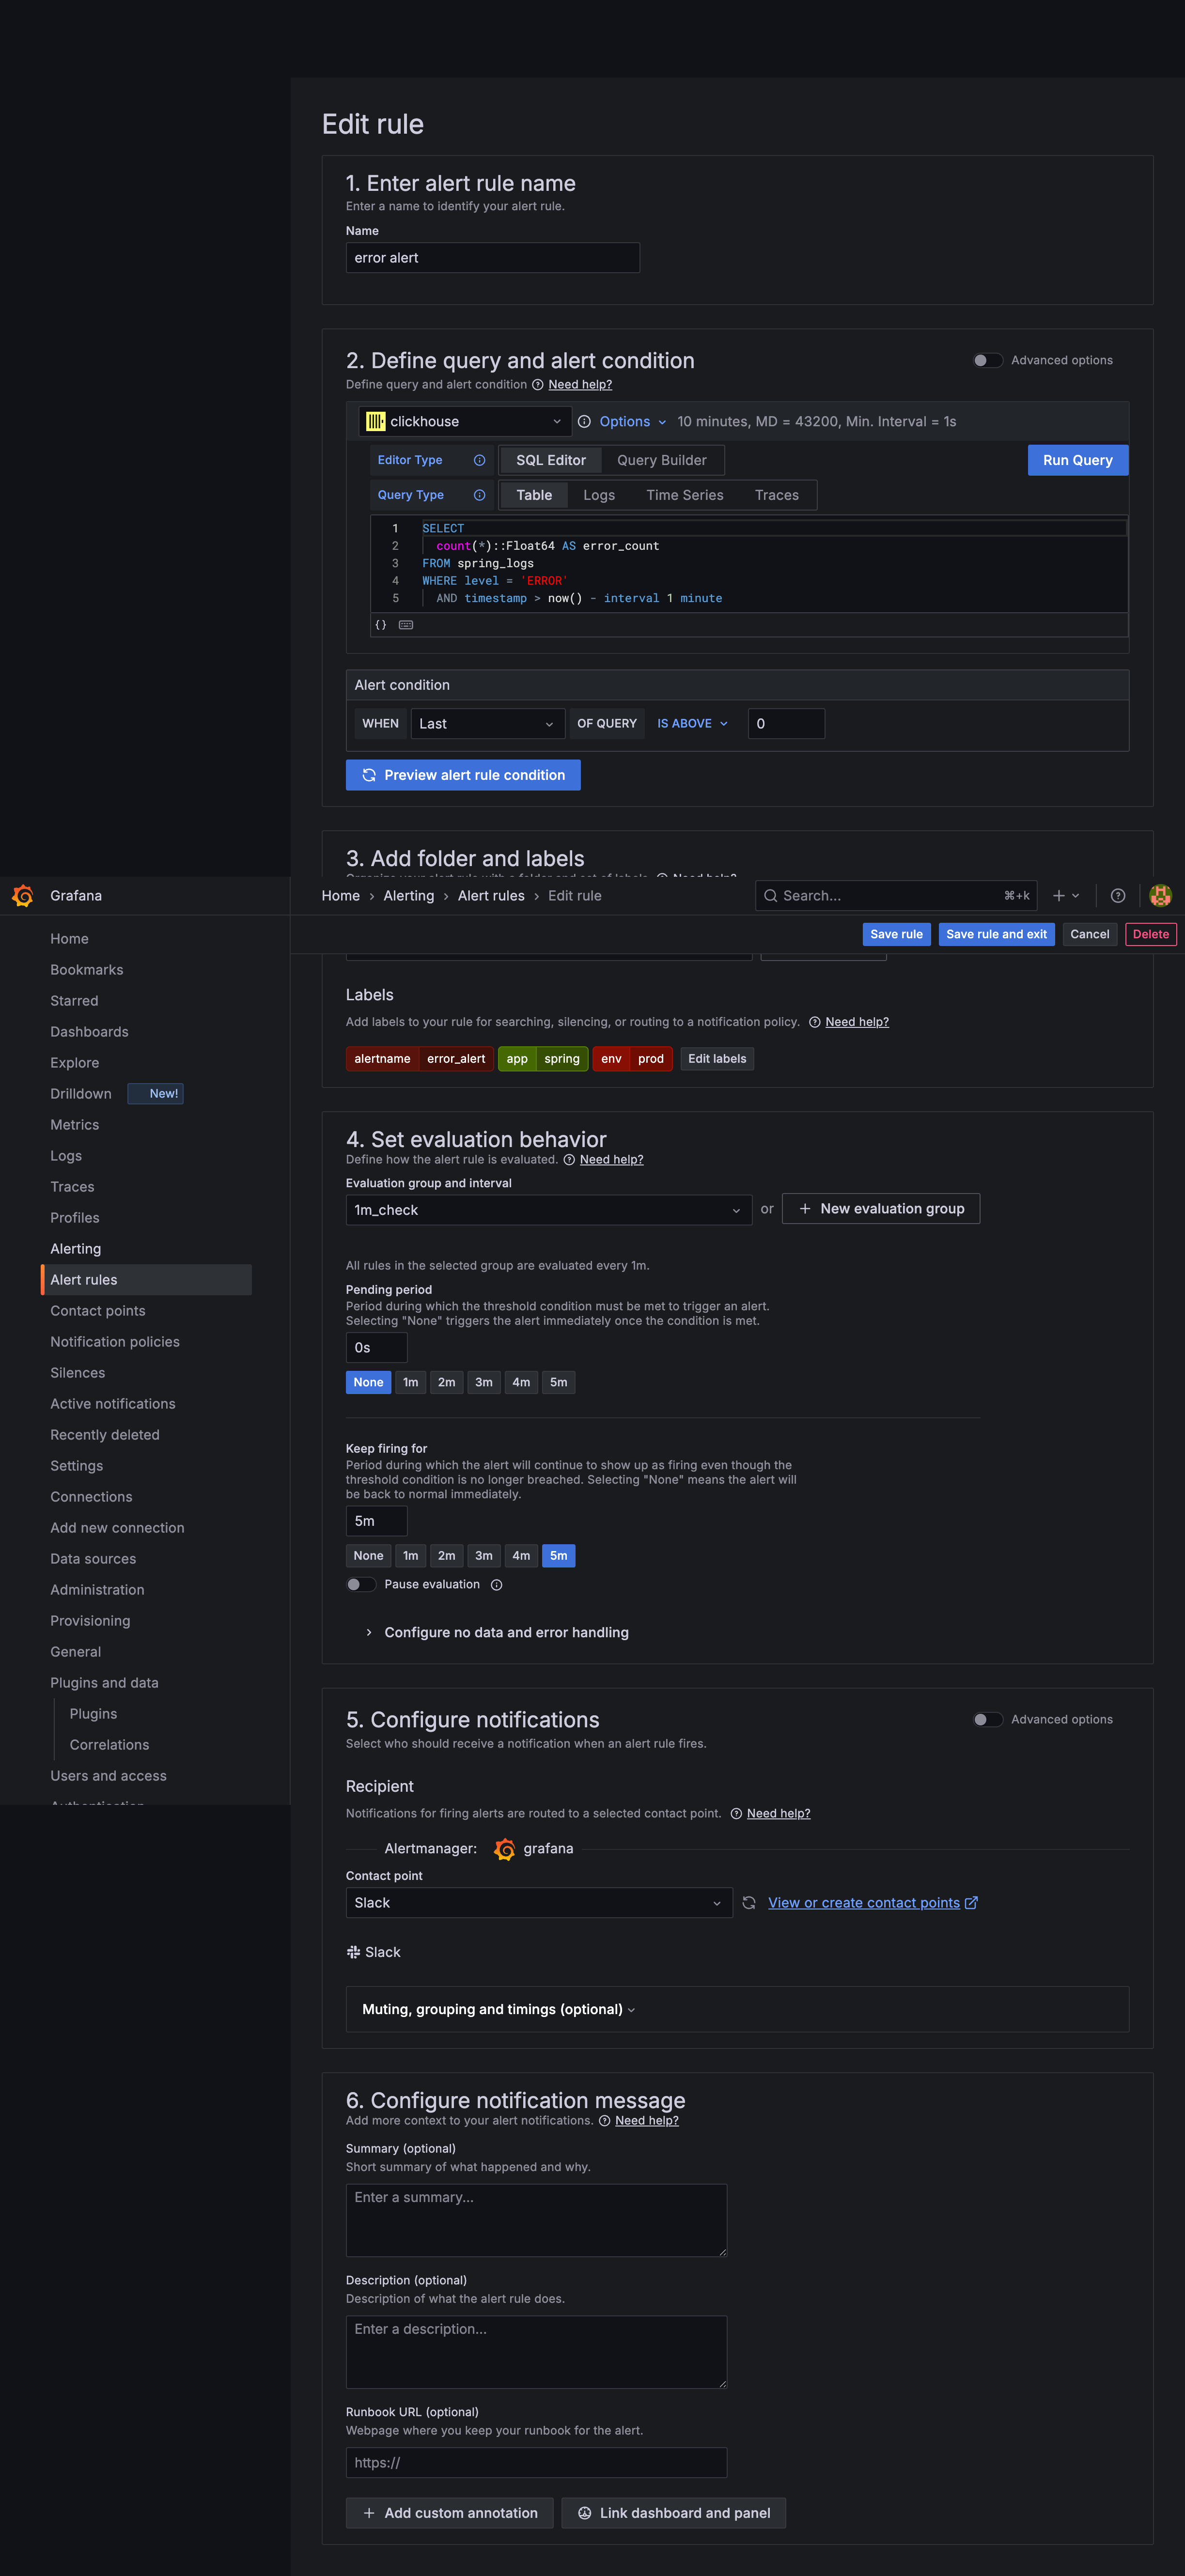
1. Alert Rule Name
Here, simply enter the name you want to use for the alert rule.
2. Define query and alert condition
This section is where you specify which query to use and under what conditions the alert should be triggered.
The query must return a Float value. So, I used Float64.
SELECT
  count(*)::Float64 AS error_count
FROM spring_logs
WHERE level = 'ERROR'
  AND timestamp > now() - interval 1 minute
I wrote the code to fetch only the errors that occurred within the last 1 minute.
Also, the alert is triggered if the error count is greater than or equal to 0, meaning that even if a single error occurs, the alert will be sent immediately.
3. Add folder and labels
Here, you can simply choose which folder to save the rule in and which labels to use for managing it.
4. Set evaluation behavior
This part is very important. I set it to check for errors every 1 minute.
There is an option called "Pending period" which means the alert will only be sent if the trigger condition is met continuously for a certain period.
The "Keep firing for" option controls how long the alert remains in the firing state.
I set this to 5 minutes, so the same error will not be sent to Slack again within 5 minutes.
5. Configure notifications
Here, just use the Slack contact point you set up earlier.
There is also an option to "Configure notification message", but since my message does not use any variables, I did not set this separately.
After saving, if you test with an actual error, you will receive the same message as before.
Also, you can easily check that the tag has changed to "firing" in the Alert-rules section.

With this, the setup is complete.
Share this post
Comments (0)
No comments yet. Be the first to comment!