Scenario
As I gained more development experience, I became increasingly interested in system architecture, especially in how companies like Toss or Stripe handle large-scale traffic.
This curiosity motivated me to study the concepts in depth and run my own experiments, which I found very valuable. That’s why I decided to write this post.
Trafic
Stripe processes over 13,000 transactions per second at peak times.(Reference)
I wanted to test the same scale, but since it’s not feasible in a local environment, I decided to simulate 2,000 TPS (Transactions Per Second) instead.
Development Enviorment
Local Enviorment
- Mac Model: Apple M3 Pro
- Memory: 36GB
- CPU: 12 core (sysctl -n hw.ncpu)
Backend Enviorment
- Backend: Java (version: 21) + Spring Boot (version: 3.5.5)
- DB: PostgreSQL
- Load Testing: k6
- Service Runtime: Docker Compose
Requirement
To test the payment system, transaction management was required.
Since real-time processing was necessary, most operations were handled synchronously.
Similar to Stripe, user payment information was received, and transactions were managed per user, accurately reflecting success, failure, and refund statuses.
As the system is expected to have more write operations than read operations, a write-heavy ratio (Write/Read) of 9:1 was defined:
- Write: Payment creation, approval, cancellation, refund (9/10 of total transactions)
- Read: Checking payment status, balance inquiries, generating reports (1/10 of total transactions)
TPS was tested at 100, 1,000, and 2,000, and at the maximum of 2,000 TPS, 120,000 transactions were executed in one minute.
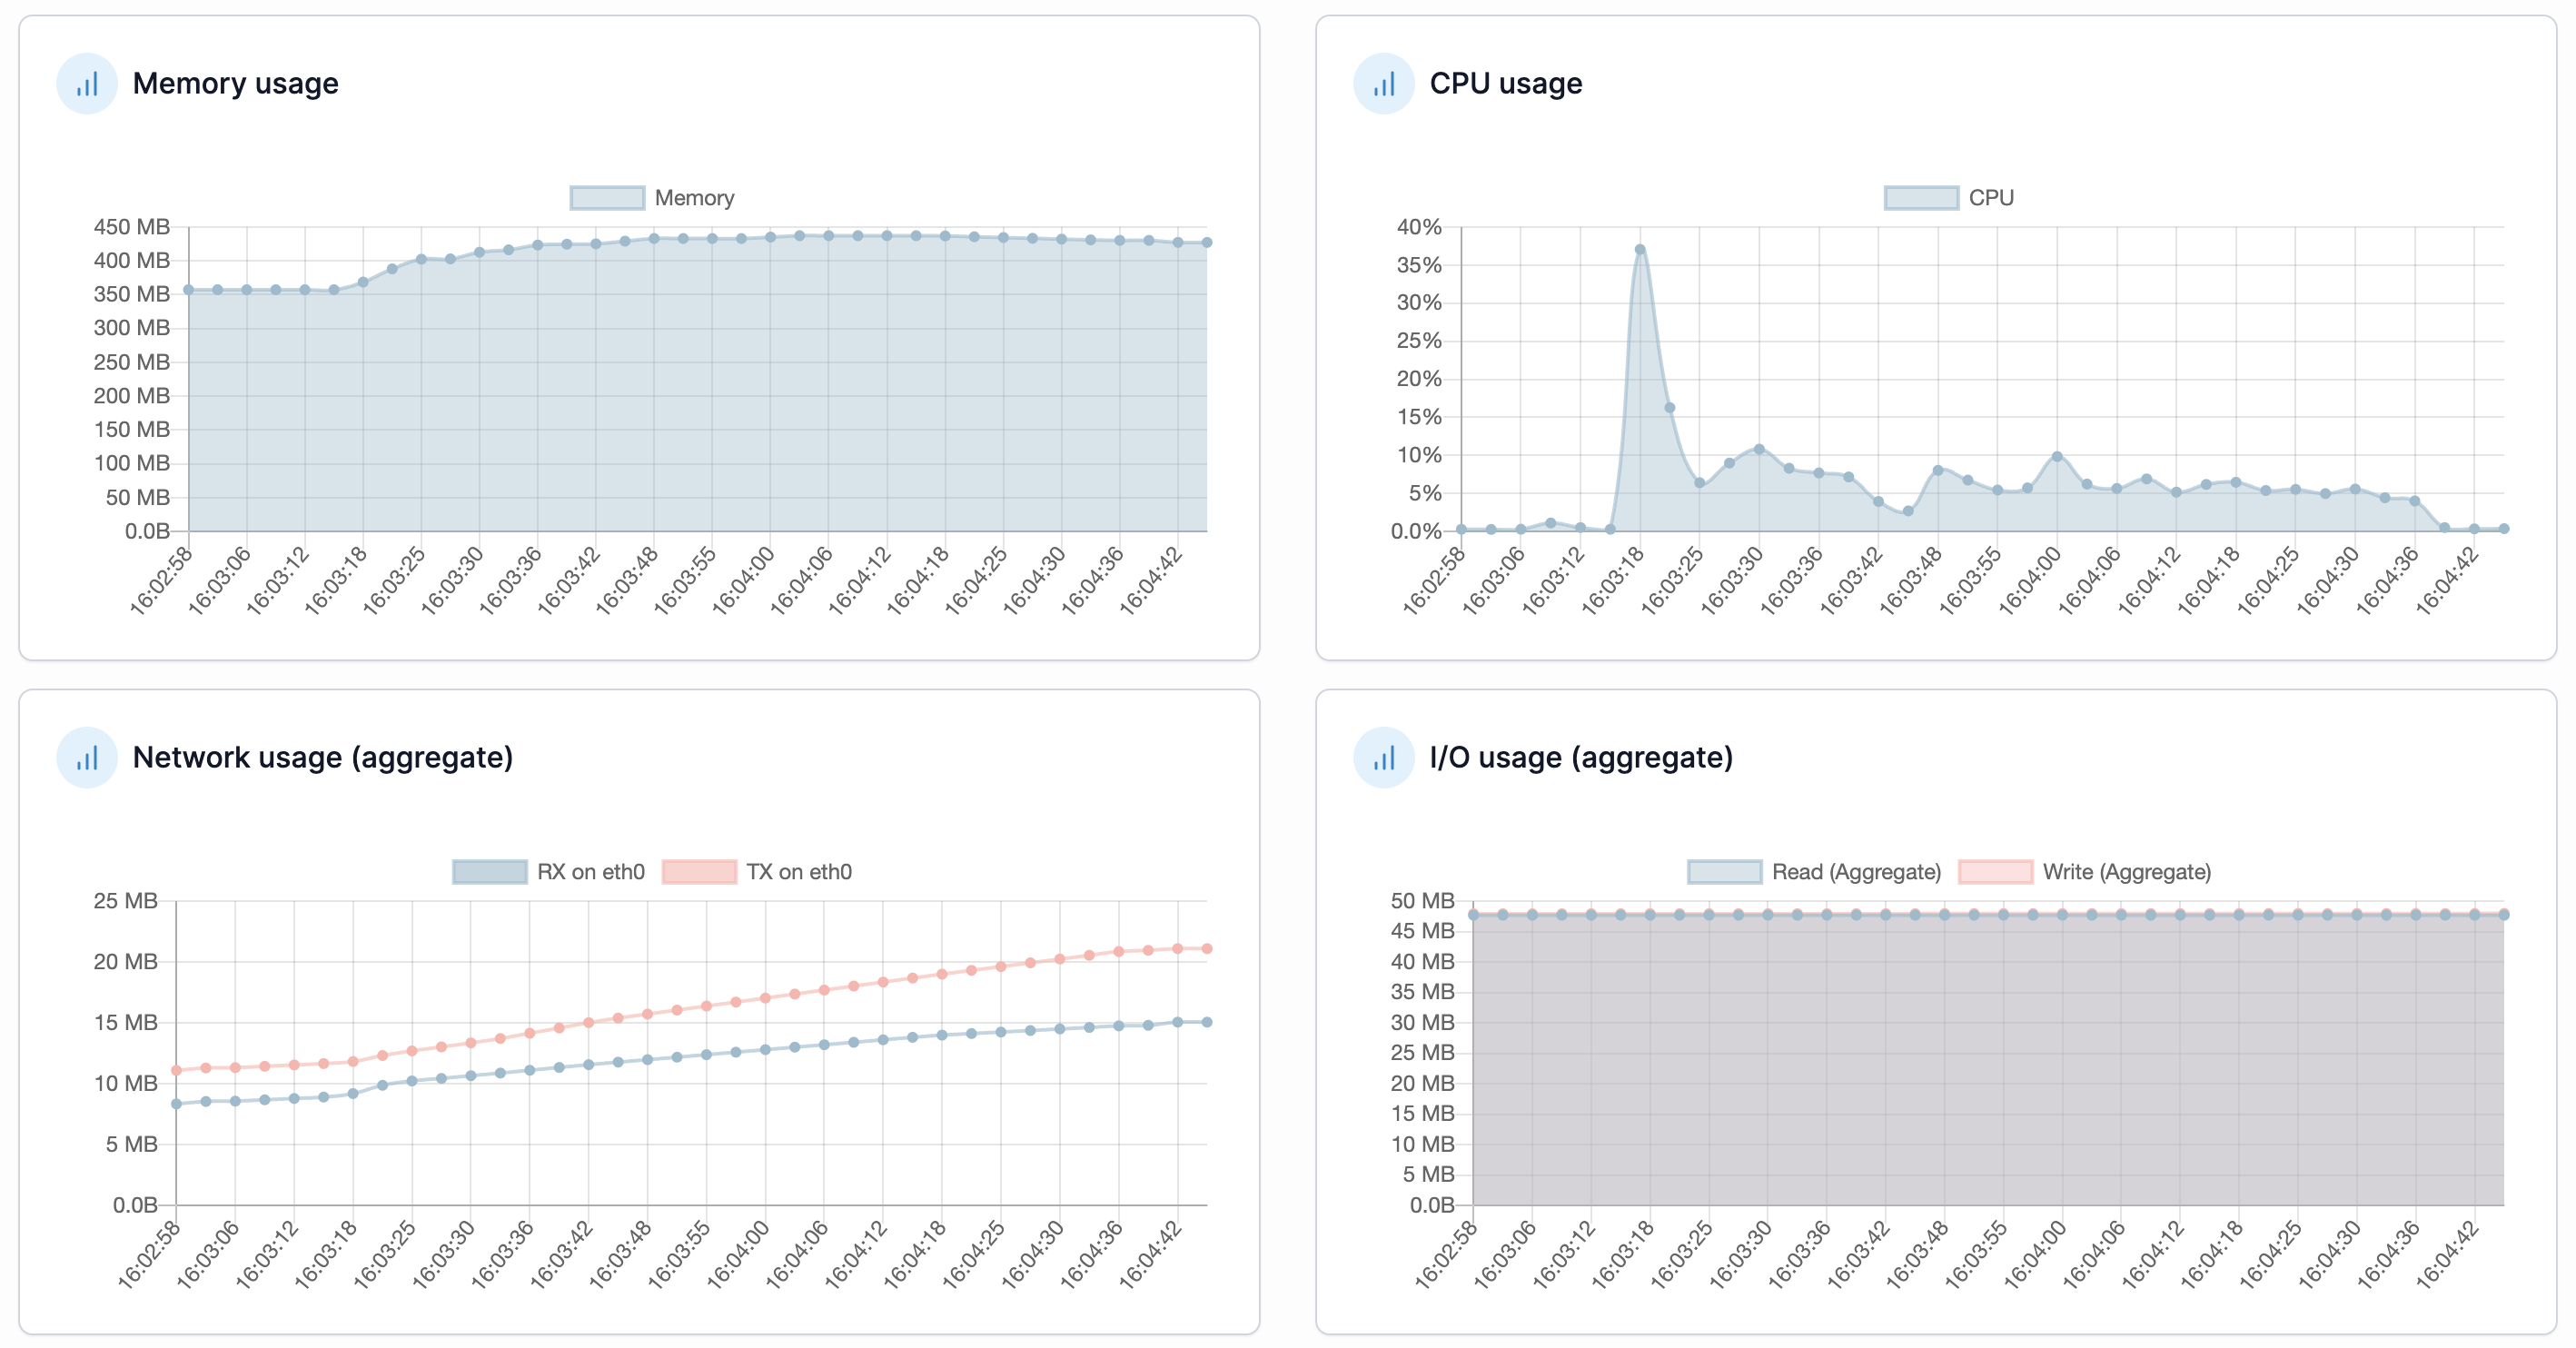
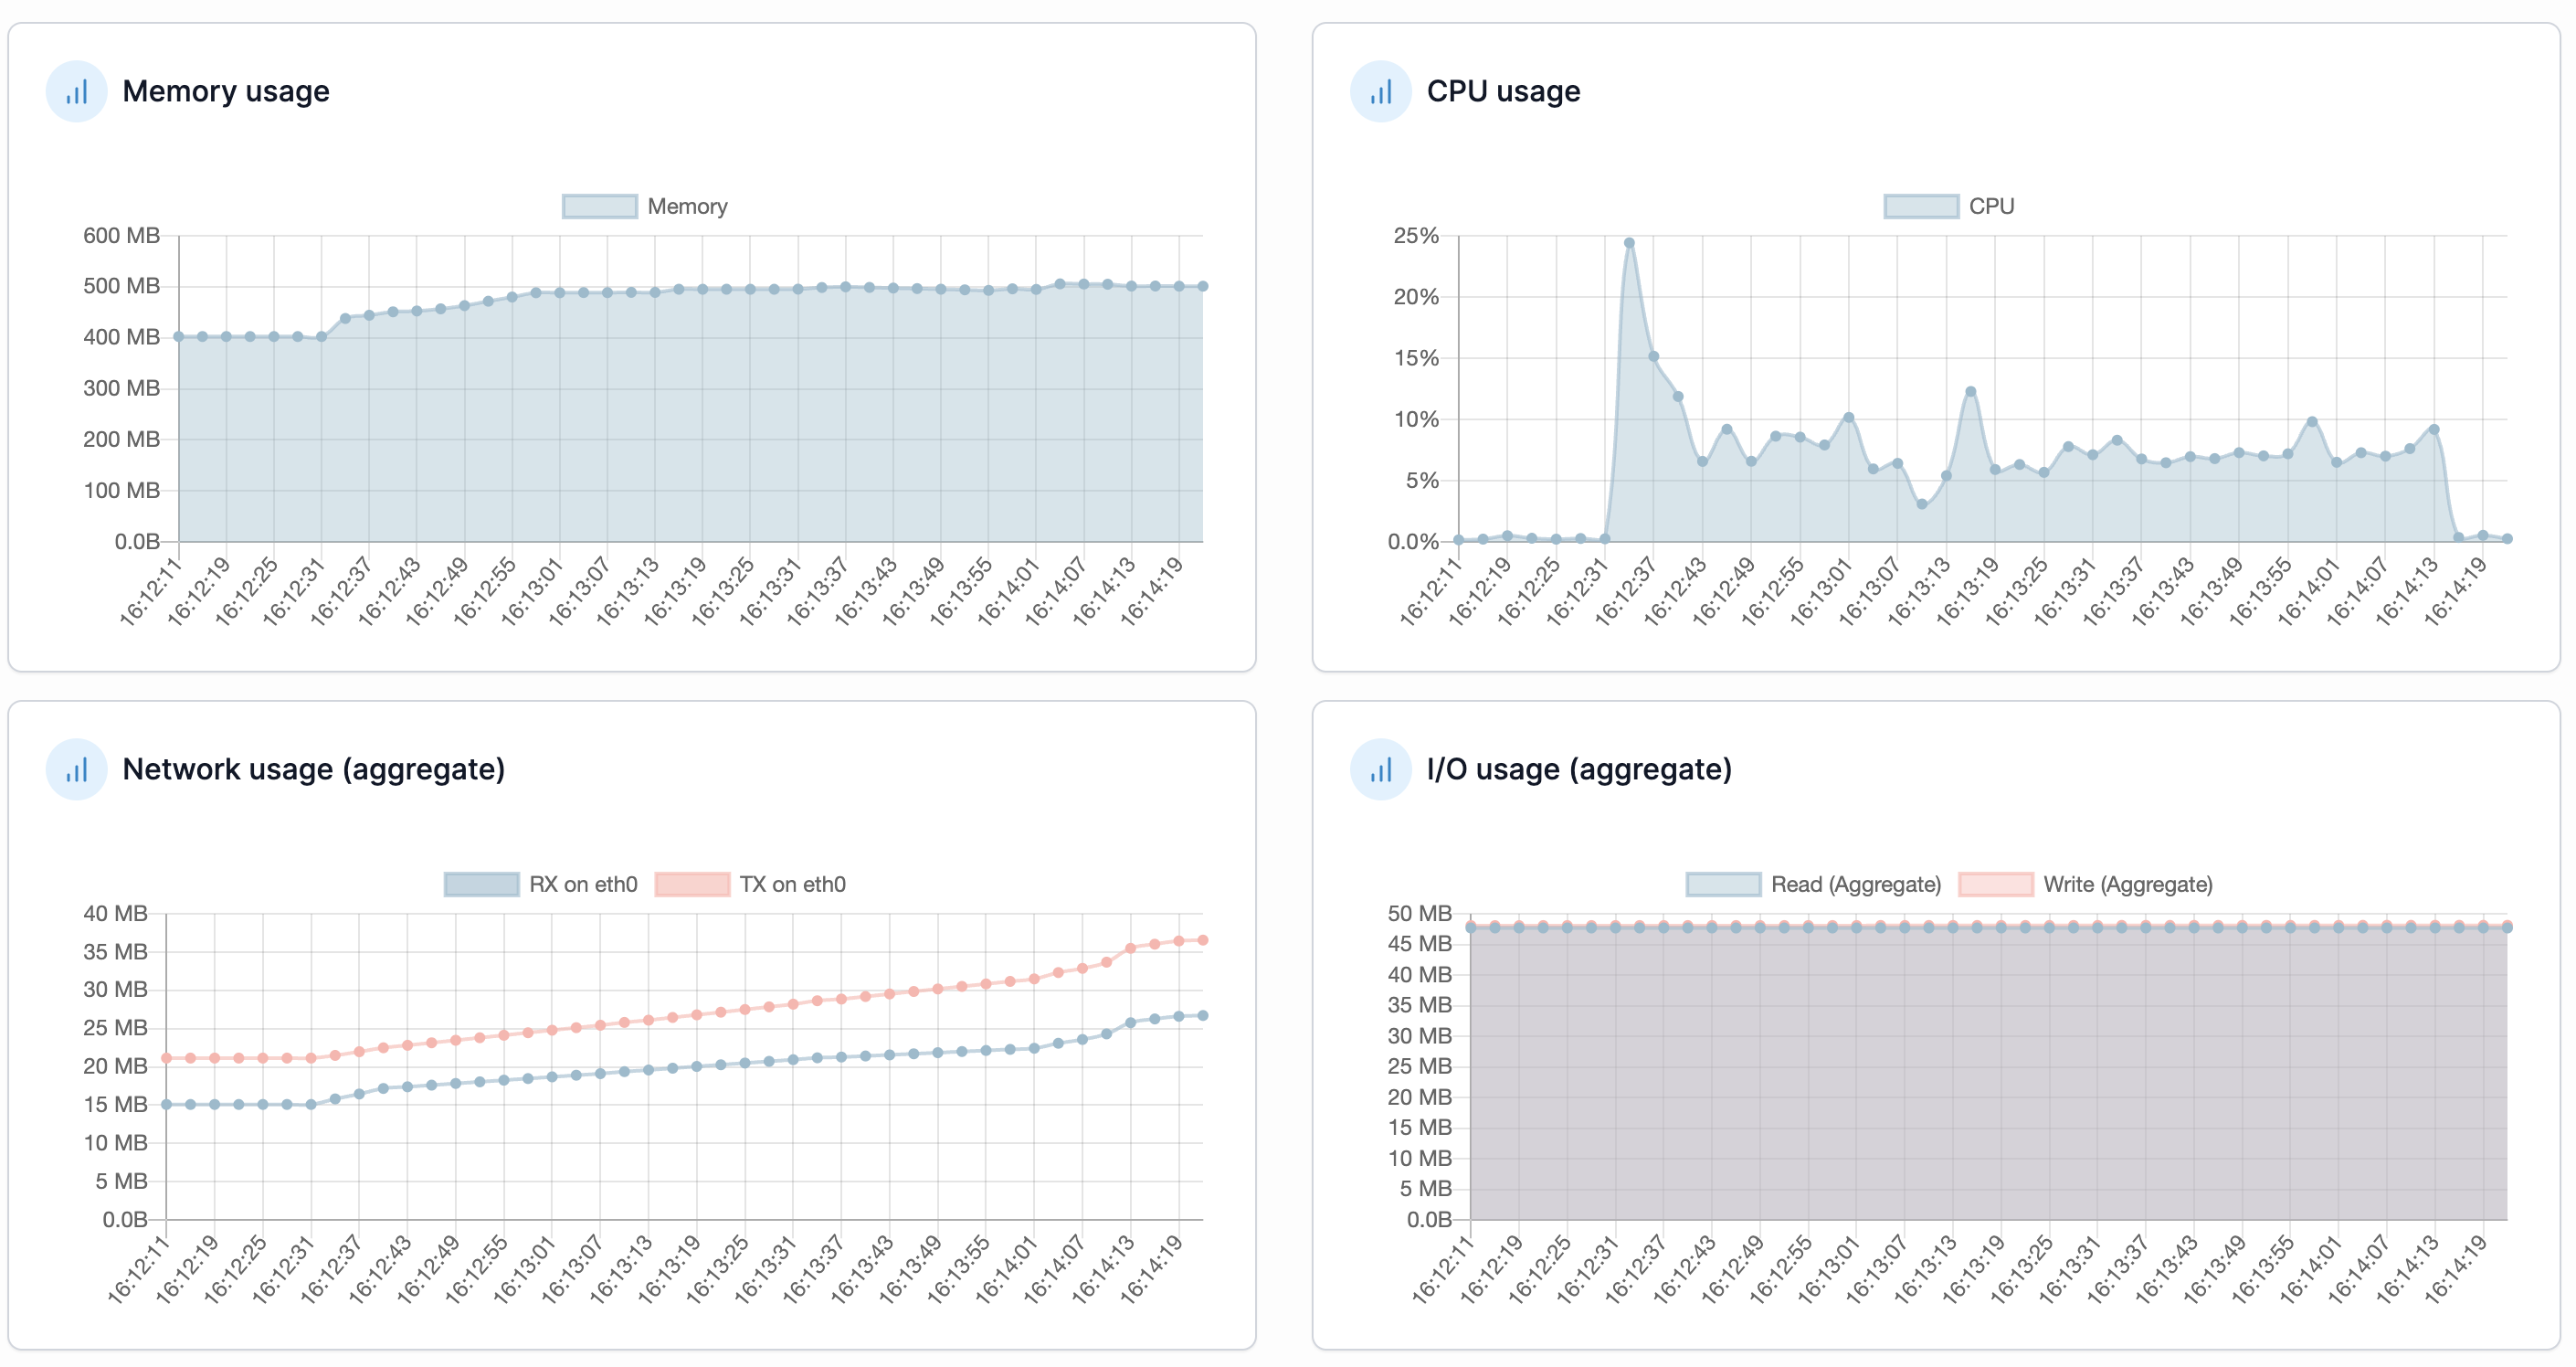
During testing, Memory, CPU, server status, and successful processing were carefully recorded, and these details will be elaborated on in this post.
Database Design
User (Seller)
| Column | Type | Description |
|---|---|---|
| id | BIGSERIAL PK | Unique seller ID |
| name | VARCHAR(100) | Seller name / shop name |
| created_at | TIMESTAMP | Account creation date |
Transaction (Payment)
| Column | Type | Description |
|---|---|---|
| id | BIGSERIAL PK | Unique transaction ID |
| user_id | BIGINT | Foreign key referencing Users table |
| amount | DECIMAL(10,2) | Payment amount |
| status | VARCHAR(50) | Transaction status (PENDING, SUCCESS, FAILED) |
| type | VARCHAR(50) | Transaction type (CREATE_PAYMENT, REFUND, CANCEL) |
| created_at | TIMESTAMP | Transaction creation date |
| updated_at | TIMESTAMP | Last status update |
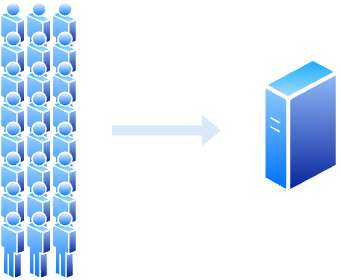
System Architecture
Initially, a single server handled all incoming requests.
Setting up Testing
The folder structure is as follows:
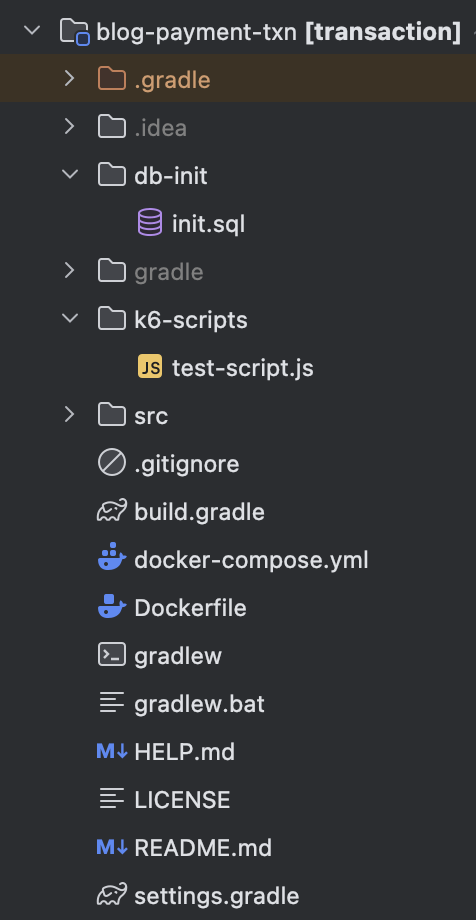
The full source code is available on GitHub Repository if you’d like to take a closer look.
To simulate real-world payment processing, the main logic introduces a small delay of 1 seconds per transaction using Thread.sleep(1s). This represents the typical processing time of a payment gateway.
For load testing, we prepared a test-script.js for k6, and init.sql automates the database setup by initializing tables and user data, allowing the simulation to run immediately.
In application.properties, we configured the connection pool to allow up to 100 connections with a maximum wait time of 30 seconds.
The default Tomcat connection limit of 200 connections was used implicitly.
properties# Maximum number of connections in the pool
spring.datasource.hikari.maximum-pool-size=100

# Maximum time to wait for a connection from the pool (in milliseconds)
spring.datasource.hikari.connection-timeout=30000
The code below is a test script for k6.
jstps_100: {
  executor: 'constant-arrival-rate',
  rate: 100, // TPS 100
  timeUnit: '1s',
  duration: '1m',
  preAllocatedVUs: 50,
  maxVUs: 200,
},
Detail
- executor: 'constant-arrival-rate' means the test will run at a fixed TPS (transactions per second).
- rate specifies the number of requests generated per second.
- timeUnit sets the unit of the rate.
- duration indicates how long the test will run.
- preAllocatedVUs is the number of virtual users initially allocated.
- maxVUs is the maximum number of virtual users. Even if the number of preAllocatedVUs is insufficient, k6 will automatically create more until reaching maxVUs.
Do Test
The build command is only needed when you modify your code or initialize the project.
When you run docker compose up -d, k6 automatically stops because no command is specified.
To run the tests, you need to execute the following command.
bashdocker compose build
docker compose up -d
docker compose run --rm k6 run /scripts/test-script.js
TPS 100
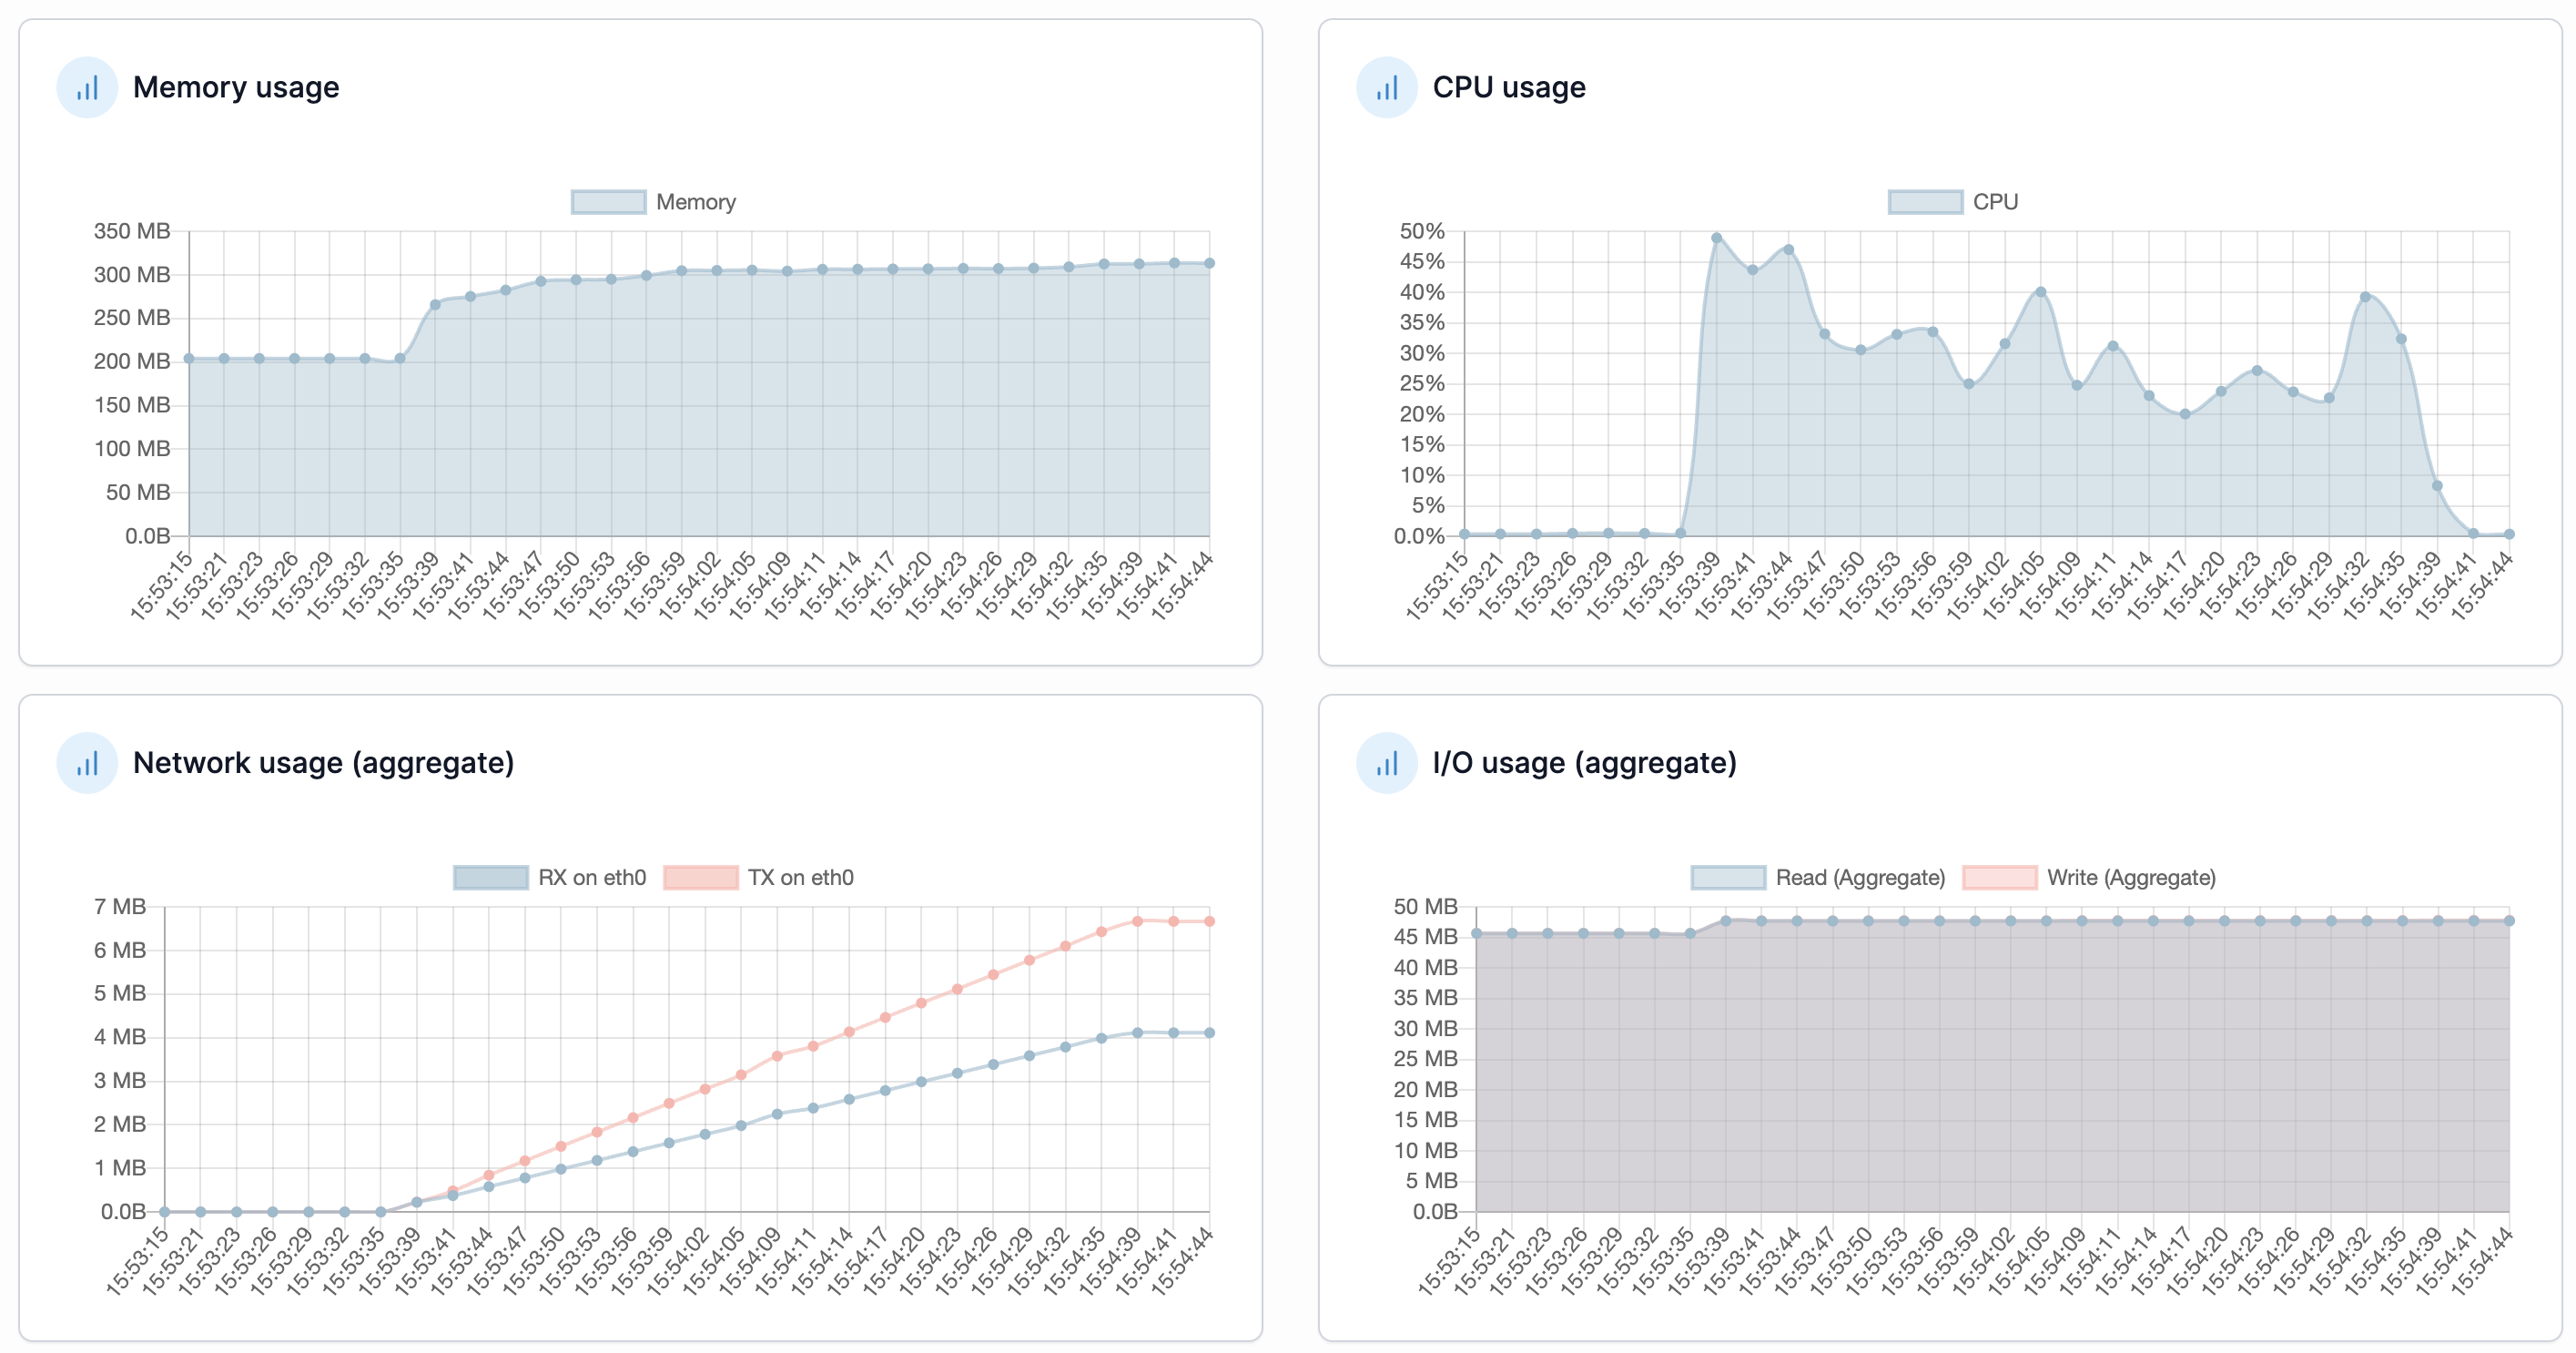
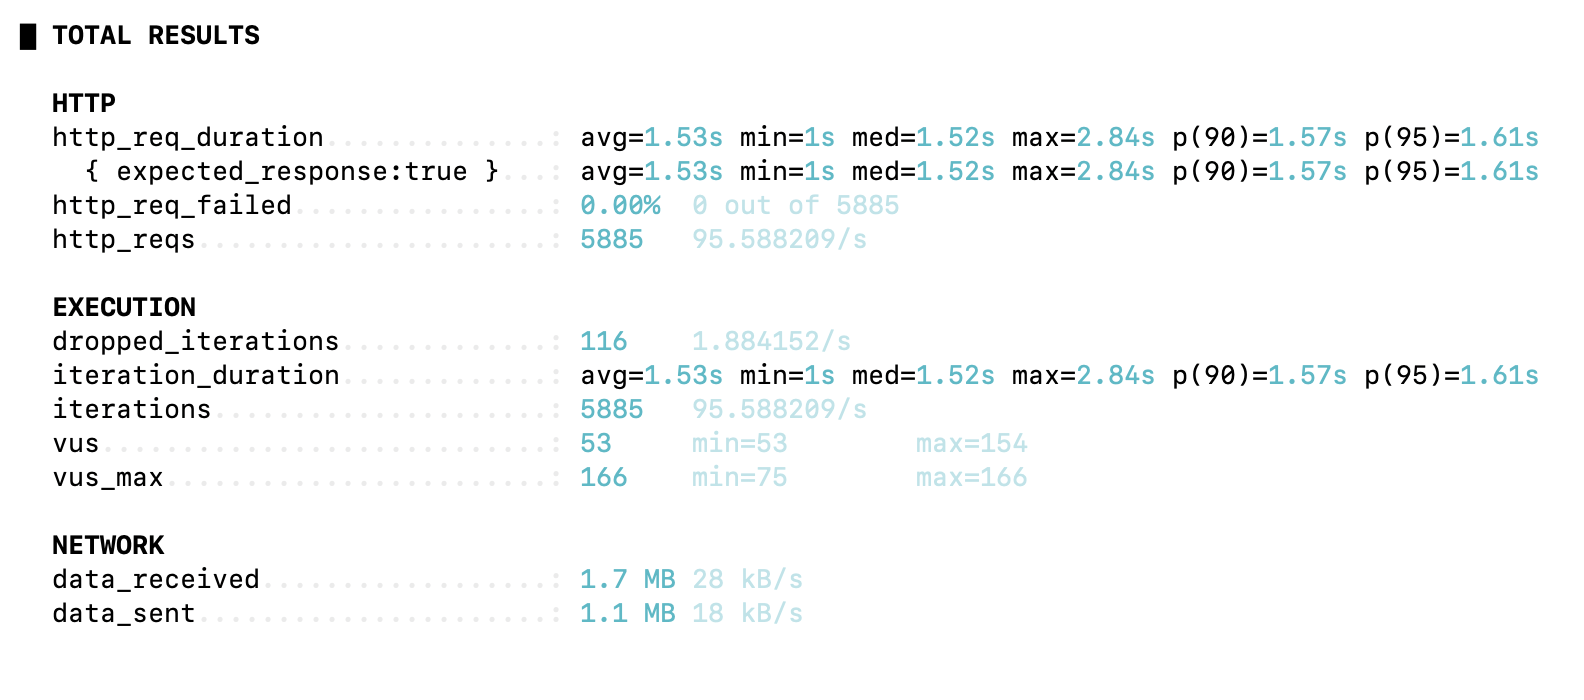
The average response time was 1.53 seconds, and the TPS was about 95.6, almost matching the target of 100 TPS.
However, some requests failed, with 116 iterations dropped.
Even at 100 TPS, dropped requests occurred, indicating that higher TPS tests would likely result in even more dropped requests.
TPS 1,000
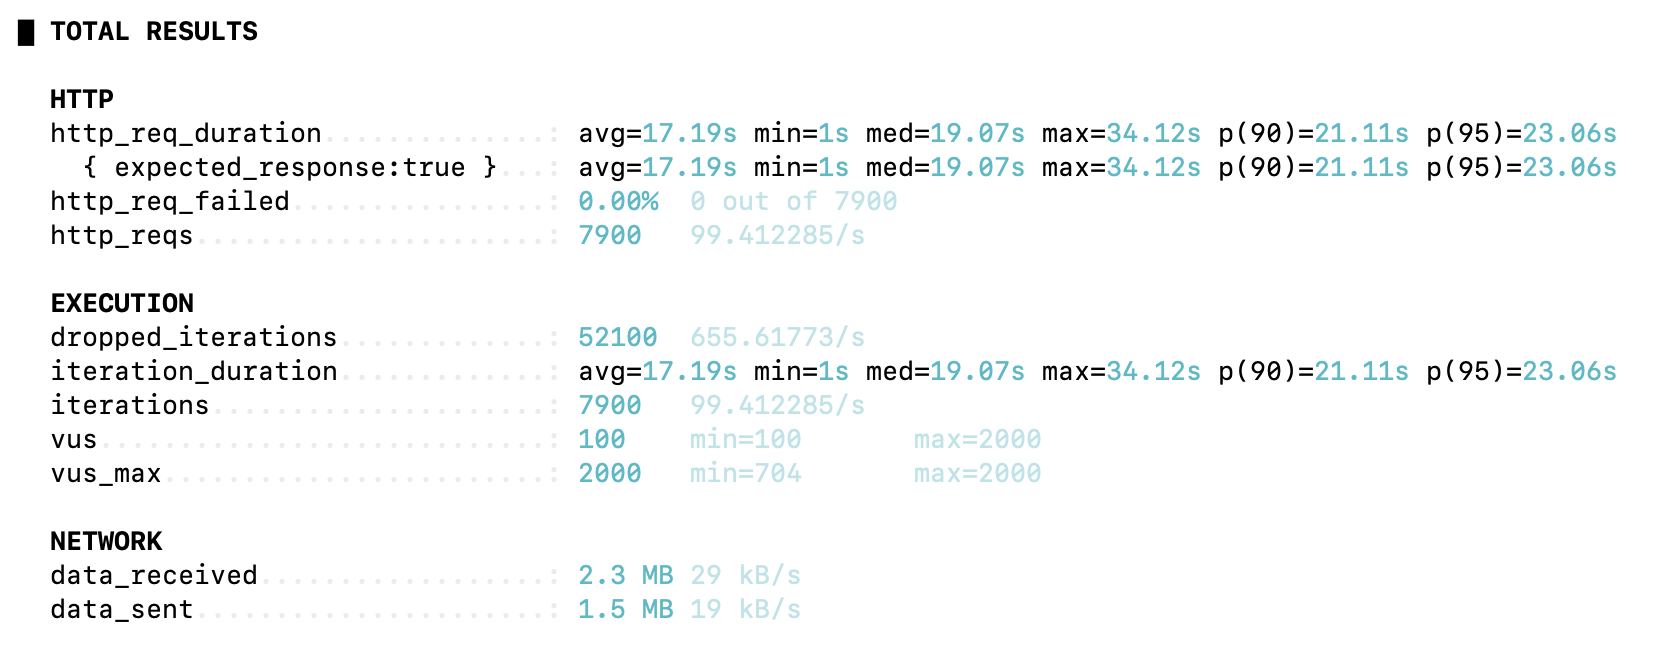
In this test, the average response time increased significantly to 17.19 seconds, while the TPS was about 99.4.
The target of 1,000 TPS was far from being reached, and 52,100 iterations were dropped, showing that the server could not handle most of the requests.
Due to the limited connection pool, the average request time was delayed to around 17 seconds.
TPS 2,000
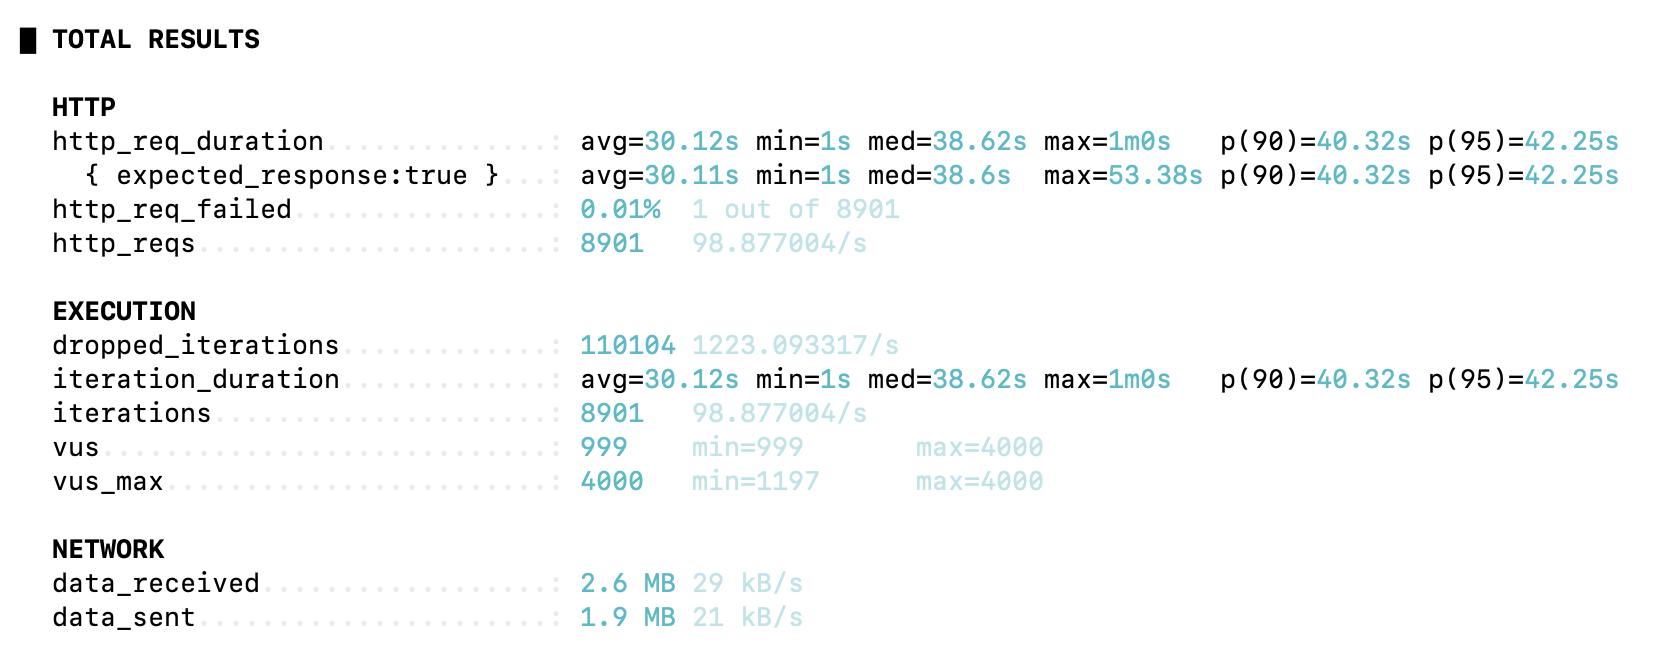
In this test, the average response time reached 30.12 seconds, which is extremely high.
The TPS was about 98.9, similar to the previous tests.
A total of 110,104 requests were dropped, showing that the server could not handle the majority of incoming requests.
Network traffic was not significant, indicating that the main bottleneck was the server and database processing limits.
When running a real service, even a single failed request can be a big deal.
So in the next post, we’ll take a look at how to improve the system to make sure every request succeeds.
Share this post
Comments (0)
No comments yet. Be the first to comment!